| |
Zuid Amerika |
|
|
|
|
|
|
|
|
|
|
|
|
|
|
|
|
| |
|
|
|
|
|
|
|
|
|
|
|
|
|
|
|
|
|
|
|
|
|
|
|
|
| |
|
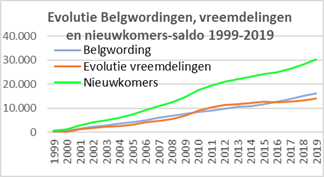
Evolutie
per jaar |
Cumul |
|
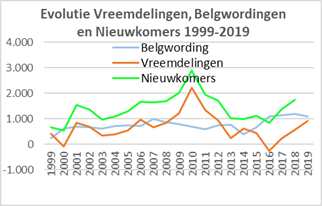
Evolutie vreemdelingen 1999-2009: |
6.824 |
|
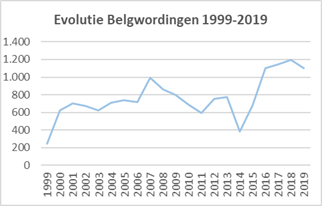
Belgwordingen 1999-2019: |
7.689 |
|
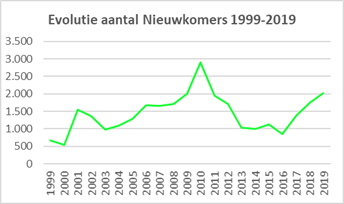
Nieuwkomers 1999-2019: |
14.513 |
|
| |
Jaar op |
Vreem- |
Evol. |
Belg- |
Nieuw- |
Evol. |
Belg- |
Nieuw- |
|
Evolutie vreemdelingen 2010-2019: |
7.272 |
|
Belgwordingen 1999-2019: |
8.429 |
|
Nieuwkomers 2010-2019: |
15.701 |
|
| |
01/01 |
delin- |
vreem- |
wor- |
komers- |
vreem- |
wor- |
komers- |
|
Evolutie vreemdelingen 1999-2019: |
14.096 |
|
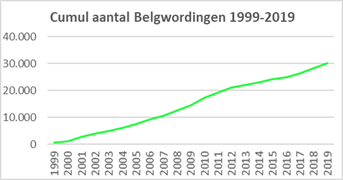
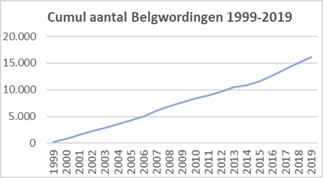
Belgwordingen 1999-2019: |
16.118 |
|
Nieuwkomers 1999-2019: |
30.214 |
|
| |
|
gen |
deling |
dingen |
saldo |
deling |
dingen |
saldo |
|
|
|
|
|
|
|
|
|
|
|
|
|
|
|
|
| |
1999 |
6.101 |
419 |
246 |
665 |
419 |
246 |
665 |
|
|
|
|
|
|
|
|
|
|
|
|
|
|
|
|
| |
2000 |
6.520 |
-83 |
623 |
540 |
336 |
869 |
1.205 |
|
|
|
|
|
|
|
|
|
|
|
|
|
|
|
|
| |
2001 |
6.437 |
849 |
701 |
1.550 |
1.185 |
1.570 |
2.755 |
|
|
|
|
|
|
|
|
|
|
|
|
|
|
|
|
| |
2002 |
7.286 |
691 |
675 |
1.366 |
1.876 |
2.245 |
4.121 |
|
|
|
|
|
|
|
|
|
|
|
|
|
|
|
|
| |
2003 |
7.977 |
350 |
621 |
971 |
2.226 |
2.866 |
5.092 |
|
|
|
|
|
|
|
|
|
|
|
|
|
|
|
|
| |
2004 |
8.327 |
386 |
708 |
1.094 |
2.612 |
3.574 |
6.186 |
|
|
|
|
|
|
|
|
|
|
|
|
|
|
|
|
| |
2005 |
8.713 |
546 |
742 |
1.288 |
3.158 |
4.316 |
7.474 |
|
|
|
|
|
|
|
|
|
|
|
|
|
|
|
|
| |
2006 |
9.259 |
956 |
720 |
1.676 |
4.114 |
5.036 |
9.150 |
|
|
|
|
|
|
|
|
|
|
|
|
|
|
|
|
| |
2007 |
10.215 |
656 |
996 |
1.652 |
4.770 |
6.032 |
10.802 |
|
|
|
|
|
|
|
|
|
|
|
|
|
|
|
|
| |
2008 |
10.871 |
840 |
862 |
1.702 |
5.610 |
6.894 |
12.504 |
|
|
|
|
|
|
|
|
|
|
|
|
|
|
|
|
| |
2009 |
11.711 |
1.214 |
795 |
2.009 |
6.824 |
7.689 |
14.513 |
|
|
|
|
|
|
|
|
|
|
|
|
|
|
|
|
| |
2010 |
12.925 |
2.208 |
690 |
2.898 |
9.032 |
8.379 |
17.411 |
|
|
|
|
|
|
|
|
|
|
|
|
|
|
|
|
| |
2011 |
15.133 |
1.347 |
594 |
1.941 |
10.379 |
8.973 |
19.352 |
|
|
|
|
|
|
|
|
|
|
|
|
|
|
|
|
| |
2012 |
16.480 |
954 |
753 |
1.707 |
11.333 |
9.726 |
21.059 |
|
|
|
|
|
|
|
|
|
|
|
|
|
|
|
|
| |
2013 |
17.434 |
250 |
777 |
1.027 |
11.583 |
10.503 |
22.086 |
|
|
|
|
|
|
|
|
|
|
|
|
|
|
|
|
| |
2014 |
17.684 |
609 |
386 |
995 |
12.192 |
10.889 |
23.081 |
|
|
|
|
|
|
|
|
|
|
|
|
|
|
|
|
| |
2015 |
18.293 |
438 |
680 |
1.118 |
12.630 |
11.569 |
24.199 |
|
|
|
|
|
|
|
|
|
|
|
|
|
|
|
|
| |
2016 |
18.731 |
-255 |
1.103 |
848 |
12.375 |
12.672 |
25.047 |
|
|
|
|
|
|
|
|
|
|
|
|
|
|
|
|
| |
2017 |
18.476 |
243 |
1.147 |
1.390 |
12.618 |
13.819 |
26.437 |
|
|
|
|
|
|
|
|
|
|
|
|
|
|
|
|
| |
2018 |
18.719 |
559 |
1.195 |
1.754 |
13.177 |
15.014 |
28.191 |
|
|
|
|
|
|
|
|
|
|
|
|
|
|
|
|
| |
2019 |
19.278 |
919 |
1.104 |
2.023 |
14.096 |
16.118 |
30.214 |
|
|
|
|
|
|
|
|
|
|
|
|
|
|
|
|
| |
2020 |
20.197 |
|
|
|
|
|
|
|
|
|
|
|
|
|
|
|
|
|
|
|
|
|
|
| |
Totaal |
|
14.096 |
16.118 |
30.214 |
|
|
|
|
|
|
|
|
|
|
|
|
|
|
|
|
|
|
|
| |
|
|
|
|
|
|
|
|
|
|
|
|
|
|
|
|
|
|
|
|
|
|
|
|
|
|
|
|
|
|
|
|
|
|
|
|
|
|
|
|
|
|
|
|
|
|
|
|
|