| |
West-Europa |
|
|
|
|
|
|
|
|
|
|
|
|
|
|
|
|
| |
|
|
|
|
|
|
|
|
|
|
|
|
|
|
|
|
|
|
|
|
|
|
|
|
| |
|
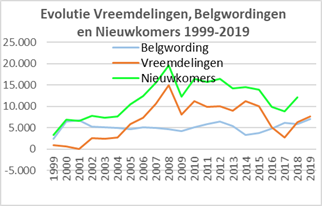
Evolutie
per jaar |
Cumul |
|
Evolutie vreemdelingen 1999-2009: |
55.905 |
|
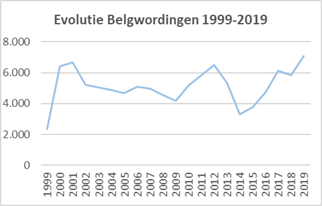
Belgwordingen 1999-2019: |
54.154 |
|
Nieuwkomers 1999-2019: |
110.059 |
|
| |
Jaar op |
Vreem- |
Evol. |
Belg- |
Nieuw- |
Evol. |
Belg- |
Nieuw- |
|
Evolutie vreemdelingen 2010-2019: |
83.082 |
|
Belgwordingen 1999-2019: |
53.694 |
|
Nieuwkomers 2010-2019: |
136.776 |
|
| |
01/01 |
delin- |
vreem- |
wor- |
komers- |
vreem- |
wor- |
komers- |
|
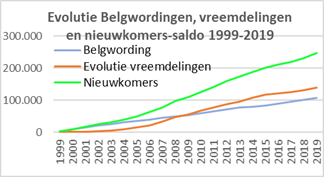
Evolutie vreemdelingen 1999-2019: |
138.987 |
|
Belgwordingen 1999-2019: |
107.848 |
|
Nieuwkomers 1999-2019: |
246.835 |
|
| |
|
gen |
deling |
dingen |
saldo |
deling |
dingen |
saldo |
|
|
|
|
|
|
|
|
|
|
|
|
|
|
|
|
| |
1999 |
566.323 |
967 |
2.377 |
3.344 |
967 |
2.377 |
3.344 |
|
|
|
|
|
|
|
|
|
|
|
|
|
|
|
|
| |
2000 |
567.290 |
547 |
6.405 |
6.952 |
1.514 |
8.782 |
10.296 |
|
|
|
|
|
|
|
|
|
|
|
|
|
|
|
|
| |
2001 |
567.837 |
-16 |
6.677 |
6.661 |
1.498 |
15.459 |
16.957 |
|
|
|
|
|
|
|
|
|
|
|
|
|
|
|
|
| |
2002 |
567.821 |
2.585 |
5.231 |
7.816 |
4.083 |
20.690 |
24.773 |
|
|
|
|
|
|
|
|
|
|
|
|
|
|
|
|
| |
2003 |
570.406 |
2.334 |
5.048 |
7.382 |
6.417 |
25.738 |
32.155 |
|
|
|
|
|
|
|
|
|
|
|
|
|
|
|
|
| |
2004 |
572.740 |
2.709 |
4.899 |
7.608 |
9.126 |
30.637 |
39.763 |
|
|
|
|
|
|
|
|
|
|
|
|
|
|
|
|
| |
2005 |
575.449 |
5.840 |
4.662 |
10.502 |
14.966 |
35.299 |
50.265 |
|
|
|
|
|
|
|
|
|
|
|
|
|
|
|
|
| |
2006 |
581.289 |
7.348 |
5.112 |
12.460 |
22.314 |
40.411 |
62.725 |
|
|
|
|
|
|
|
|
|
|
|
|
|
|
|
|
| |
2007 |
588.637 |
10.588 |
4.974 |
15.562 |
32.902 |
45.385 |
78.287 |
|
|
|
|
|
|
|
|
|
|
|
|
|
|
|
|
| |
2008 |
599.225 |
14.937 |
4.574 |
19.511 |
47.839 |
49.959 |
97.798 |
|
|
|
|
|
|
|
|
|
|
|
|
|
|
|
|
| |
2009 |
614.162 |
8.066 |
4.195 |
12.261 |
55.905 |
54.154 |
110.059 |
|
|
|
|
|
|
|
|
|
|
|
|
|
|
|
|
| |
2010 |
622.228 |
11.227 |
5.166 |
16.393 |
67.132 |
59.320 |
126.452 |
|
|
|
|
|
|
|
|
|
|
|
|
|
|
|
|
| |
2011 |
633.455 |
9.902 |
5.819 |
15.721 |
77.034 |
65.139 |
142.173 |
|
|
|
|
|
|
|
|
|
|
|
|
|
|
|
|
| |
2012 |
643.357 |
9.958 |
6.489 |
16.447 |
86.992 |
71.628 |
158.620 |
|
|
|
|
|
|
|
|
|
|
|
|
|
|
|
|
| |
2013 |
653.315 |
8.913 |
5.335 |
14.248 |
95.905 |
76.963 |
172.868 |
|
|
|
|
|
|
|
|
|
|
|
|
|
|
|
|
| |
2014 |
662.228 |
11.212 |
3.296 |
14.508 |
107.117 |
80.259 |
187.376 |
|
|
|
|
|
|
|
|
|
|
|
|
|
|
|
|
| |
2015 |
673.440 |
10.088 |
3.779 |
13.867 |
117.205 |
84.038 |
201.243 |
|
|
|
|
|
|
|
|
|
|
|
|
|
|
|
|
| |
2016 |
683.528 |
5.139 |
4.737 |
9.876 |
122.344 |
88.775 |
211.119 |
|
|
|
|
|
|
|
|
|
|
|
|
|
|
|
|
| |
2017 |
688.667 |
2.703 |
6.136 |
8.839 |
125.047 |
94.911 |
219.958 |
|
|
|
|
|
|
|
|
|
|
|
|
|
|
|
|
| |
2018 |
691.370 |
6.283 |
5.840 |
12.123 |
131.330 |
100.751 |
232.081 |
|
|
|
|
|
|
|
|
|
|
|
|
|
|
|
|
| |
2019 |
697.653 |
7.657 |
7.097 |
14.754 |
138.987 |
107.848 |
246.835 |
|
|
|
|
|
|
|
|
|
|
|
|
|
|
|
|
| |
2020 |
705.310 |
|
|
|
|
|
|
|
|
|
|
|
|
|
|
|
|
|
|
|
|
|
|
| |
Totaal |
|
138.987 |
107.848 |
246.835 |
|
|
|
|
|
|
|
|
|
|
|
|
|
|
|
|
|
|
|
| |
|
|
|
|
|
|
|
|
|
|
|
|
|
|
|
|
|
|
|
|
|
|
|
|
|
|
|
|
|
|
|
|
|
|
|
|
|
|
|
|
|
|
|
|
|
|
|
|
|