| |
Turkije |
|
|
|
|
|
|
|
|
|
|
|
|
|
|
|
|
| |
|
|
|
|
|
|
|
|
|
|
|
|
|
|
|
|
|
|
|
|
|
|
|
|
| |
|
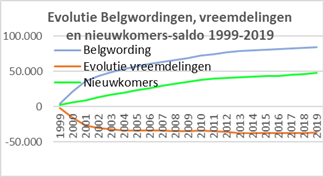
Evolutie
per jaar |
Cumul |
|
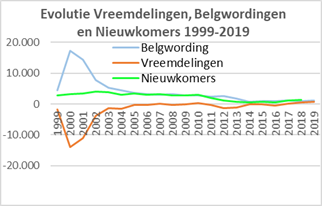
Evolutie vreemdelingen 1999-2009: |
-34.228 |
|
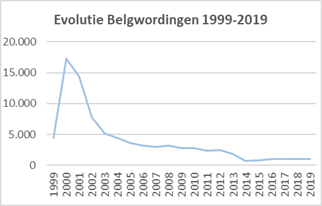
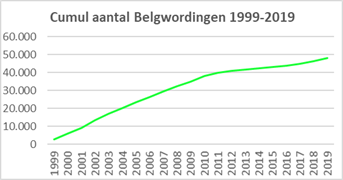
Belgwordingen 1999-2019: |
69.333 |
|
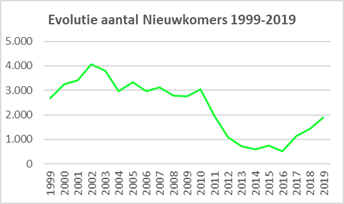
Nieuwkomers 1999-2019: |
35.105 |
|
| |
Jaar op |
Vreem- |
Evol. |
Belg- |
Nieuw- |
Evol. |
Belg- |
Nieuw- |
|
Evolutie vreemdelingen 2010-2019: |
-2.059 |
|
Belgwordingen 1999-2019: |
15.135 |
|
Nieuwkomers 2010-2019: |
13.076 |
|
| |
01/01 |
delin- |
vreem- |
wor- |
komers- |
vreem- |
wor- |
komers- |
|
Evolutie vreemdelingen 1999-2019: |
-36.287 |
|
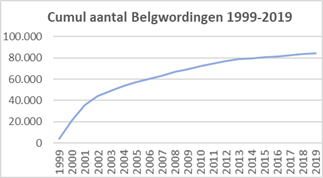
Belgwordingen 1999-2019: |
84.468 |
|
Nieuwkomers 1999-2019: |
48.181 |
|
| |
|
gen |
deling |
dingen |
saldo |
deling |
dingen |
saldo |
|
|
|
|
|
|
|
|
|
|
|
|
|
|
|
|
| |
1999 |
73.779 |
-1.715 |
4.402 |
2.687 |
-1.715 |
4.402 |
2.687 |
|
|
|
|
|
|
|
|
|
|
|
|
|
|
|
|
| |
2000 |
72.064 |
-14.037 |
17.282 |
3.245 |
-15.752 |
21.684 |
5.932 |
|
|
|
|
|
|
|
|
|
|
|
|
|
|
|
|
| |
2001 |
58.027 |
-10.983 |
14.401 |
3.418 |
-26.735 |
36.085 |
9.350 |
|
|
|
|
|
|
|
|
|
|
|
|
|
|
|
|
| |
2002 |
47.044 |
-3.744 |
7.805 |
4.061 |
-30.479 |
43.890 |
13.411 |
|
|
|
|
|
|
|
|
|
|
|
|
|
|
|
|
| |
2003 |
43.300 |
-1.384 |
5.186 |
3.802 |
-31.863 |
49.076 |
17.213 |
|
|
|
|
|
|
|
|
|
|
|
|
|
|
|
|
| |
2004 |
41.916 |
-1.513 |
4.467 |
2.954 |
-33.376 |
53.543 |
20.167 |
|
|
|
|
|
|
|
|
|
|
|
|
|
|
|
|
| |
2005 |
40.403 |
-278 |
3.602 |
3.324 |
-33.654 |
57.145 |
23.491 |
|
|
|
|
|
|
|
|
|
|
|
|
|
|
|
|
| |
2006 |
40.125 |
-243 |
3.204 |
2.961 |
-33.897 |
60.349 |
26.452 |
|
|
|
|
|
|
|
|
|
|
|
|
|
|
|
|
| |
2007 |
39.882 |
72 |
3.039 |
3.111 |
-33.825 |
63.388 |
29.563 |
|
|
|
|
|
|
|
|
|
|
|
|
|
|
|
|
| |
2008 |
39.954 |
-390 |
3.182 |
2.792 |
-34.215 |
66.570 |
32.355 |
|
|
|
|
|
|
|
|
|
|
|
|
|
|
|
|
| |
2009 |
39.564 |
-13 |
2.763 |
2.750 |
-34.228 |
69.333 |
35.105 |
|
|
|
|
|
|
|
|
|
|
|
|
|
|
|
|
| |
2010 |
39.551 |
277 |
2.760 |
3.037 |
-33.951 |
72.093 |
38.142 |
|
|
|
|
|
|
|
|
|
|
|
|
|
|
|
|
| |
2011 |
39.828 |
-398 |
2.359 |
1.961 |
-34.349 |
74.452 |
40.103 |
|
|
|
|
|
|
|
|
|
|
|
|
|
|
|
|
| |
2012 |
39.430 |
-1.441 |
2.517 |
1.076 |
-35.790 |
76.969 |
41.179 |
|
|
|
|
|
|
|
|
|
|
|
|
|
|
|
|
| |
2013 |
37.989 |
-1.148 |
1.857 |
709 |
-36.938 |
78.826 |
41.888 |
|
|
|
|
|
|
|
|
|
|
|
|
|
|
|
|
| |
2014 |
36.841 |
-94 |
691 |
597 |
-37.032 |
79.517 |
42.485 |
|
|
|
|
|
|
|
|
|
|
|
|
|
|
|
|
| |
2015 |
36.747 |
-97 |
843 |
746 |
-37.129 |
80.360 |
43.231 |
|
|
|
|
|
|
|
|
|
|
|
|
|
|
|
|
| |
2016 |
36.650 |
-483 |
989 |
506 |
-37.612 |
81.349 |
43.737 |
|
|
|
|
|
|
|
|
|
|
|
|
|
|
|
|
| |
2017 |
36.167 |
66 |
1.061 |
1.127 |
-37.546 |
82.410 |
44.864 |
|
|
|
|
|
|
|
|
|
|
|
|
|
|
|
|
| |
2018 |
36.233 |
445 |
985 |
1.430 |
-37.101 |
83.395 |
46.294 |
|
|
|
|
|
|
|
|
|
|
|
|
|
|
|
|
| |
2019 |
36.678 |
814 |
1.073 |
1.887 |
-36.287 |
84.468 |
48.181 |
|
|
|
|
|
|
|
|
|
|
|
|
|
|
|
|
| |
2020 |
37.492 |
|
|
|
|
|
|
|
|
|
|
|
|
|
|
|
|
|
|
|
|
|
|
| |
Totaal |
|
-36.287 |
84.468 |
48.181 |
|
|
|
|
|
|
|
|
|
|
|
|
|
|
|
|
|
|
|
| |
|
|
|
|
|
|
|
|
|
|
|
|
|
|
|
|
|
|
|
|
|
|
|
|
|
|
|
|
|
|
|
|
|
|
|
|
|
|
|
|
|
|
|
|
|
|
|
|
|