| |
Totaal |
|
|
|
|
|
|
|
|
|
|
|
|
|
|
|
|
| |
|
|
|
|
|
|
|
|
|
|
|
|
|
|
|
|
|
|
|
|
|
|
|
|
| |
|
Evolutie
per jaar |
Cumul |
|
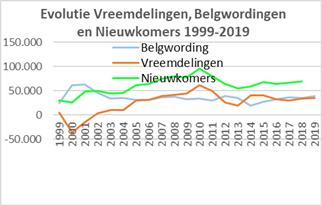
Evolutie vreemdelingen 1999-2009: |
165.684 |
|
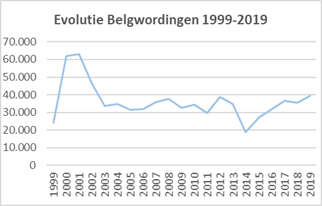
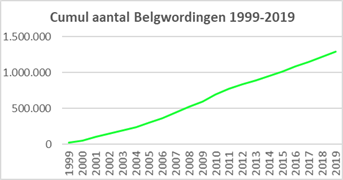
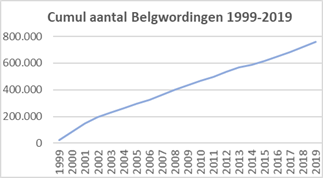
Belgwordingen 1999-2019: |
432.976 |
|
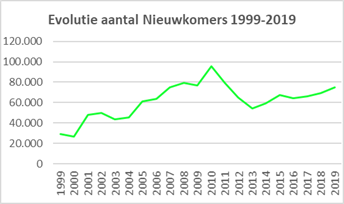
Nieuwkomers 1999-2019: |
598.660 |
|
| |
Jaar op |
Vreem- |
Evol. |
Belg- |
Nieuw- |
Evol. |
Belg- |
Nieuw- |
|
Evolutie vreemdelingen 2010-2019: |
369.217 |
|
Belgwordingen 1999-2019: |
326.533 |
|
Nieuwkomers 2010-2019: |
695.750 |
|
| |
01/01 |
delin- |
vreem- |
wor- |
komers- |
vreem- |
wor- |
komers- |
|
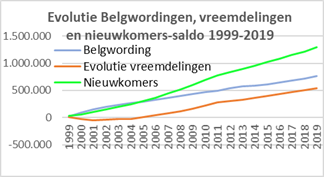
Evolutie vreemdelingen 1999-2019: |
534.901 |
|
Belgwordingen 1999-2019: |
759.509 |
|
Nieuwkomers 1999-2019: |
1.294.410 |
|
| |
|
gen |
deling |
dingen |
saldo |
deling |
dingen |
saldo |
|
|
|
|
|
|
|
|
|
|
|
|
|
|
|
|
| |
1999 |
891.980 |
5.130 |
24.119 |
29.249 |
5.130 |
24.119 |
29.249 |
|
|
|
|
|
|
|
|
|
|
|
|
|
|
|
|
| |
2000 |
897.110 |
-35.426 |
61.878 |
26.452 |
-30.296 |
85.997 |
55.701 |
|
|
|
|
|
|
|
|
|
|
|
|
|
|
|
|
| |
2001 |
861.684 |
-14.950 |
62.881 |
47.931 |
-45.246 |
148.878 |
103.632 |
|
|
|
|
|
|
|
|
|
|
|
|
|
|
|
|
| |
2002 |
846.734 |
3.343 |
46.314 |
49.657 |
-41.903 |
195.192 |
153.289 |
|
|
|
|
|
|
|
|
|
|
|
|
|
|
|
|
| |
2003 |
850.077 |
10.210 |
33.633 |
43.843 |
-31.693 |
228.825 |
197.132 |
|
|
|
|
|
|
|
|
|
|
|
|
|
|
|
|
| |
2004 |
860.287 |
10.575 |
34.659 |
45.234 |
-21.118 |
263.484 |
242.366 |
|
|
|
|
|
|
|
|
|
|
|
|
|
|
|
|
| |
2005 |
870.862 |
29.611 |
31.412 |
61.023 |
8.493 |
294.896 |
303.389 |
|
|
|
|
|
|
|
|
|
|
|
|
|
|
|
|
| |
2006 |
900.473 |
31.688 |
31.790 |
63.478 |
40.181 |
326.686 |
366.867 |
|
|
|
|
|
|
|
|
|
|
|
|
|
|
|
|
| |
2007 |
932.161 |
39.285 |
35.945 |
75.230 |
79.466 |
362.631 |
442.097 |
|
|
|
|
|
|
|
|
|
|
|
|
|
|
|
|
| |
2008 |
971.446 |
41.811 |
37.637 |
79.448 |
121.277 |
400.268 |
521.545 |
|
|
|
|
|
|
|
|
|
|
|
|
|
|
|
|
| |
2009 |
1.013.257 |
44.407 |
32.708 |
77.115 |
165.684 |
432.976 |
598.660 |
|
|
|
|
|
|
|
|
|
|
|
|
|
|
|
|
| |
2010 |
1.057.664 |
61.600 |
34.246 |
95.846 |
227.284 |
467.222 |
694.506 |
|
|
|
|
|
|
|
|
|
|
|
|
|
|
|
|
| |
2011 |
1.119.264 |
49.830 |
29.786 |
79.616 |
277.114 |
497.008 |
774.122 |
|
|
|
|
|
|
|
|
|
|
|
|
|
|
|
|
| |
2012 |
1.169.094 |
26.035 |
38.610 |
64.645 |
303.149 |
535.618 |
838.767 |
|
|
|
|
|
|
|
|
|
|
|
|
|
|
|
|
| |
2013 |
1.195.129 |
19.467 |
34.801 |
54.268 |
322.616 |
570.419 |
893.035 |
|
|
|
|
|
|
|
|
|
|
|
|
|
|
|
|
| |
2014 |
1.214.596 |
40.690 |
18.726 |
59.416 |
363.306 |
589.145 |
952.451 |
|
|
|
|
|
|
|
|
|
|
|
|
|
|
|
|
| |
2015 |
1.255.286 |
40.362 |
27.071 |
67.433 |
403.668 |
616.216 |
1.019.884 |
|
|
|
|
|
|
|
|
|
|
|
|
|
|
|
|
| |
2016 |
1.295.648 |
32.128 |
31.937 |
64.065 |
435.796 |
648.153 |
1.083.949 |
|
|
|
|
|
|
|
|
|
|
|
|
|
|
|
|
| |
2017 |
1.327.776 |
29.709 |
36.687 |
66.396 |
465.505 |
684.840 |
1.150.345 |
|
|
|
|
|
|
|
|
|
|
|
|
|
|
|
|
| |
2018 |
1.357.485 |
33.976 |
35.333 |
69.309 |
499.481 |
720.173 |
1.219.654 |
|
|
|
|
|
|
|
|
|
|
|
|
|
|
|
|
| |
2019 |
1.391.461 |
35.420 |
39.336 |
74.756 |
534.901 |
759.509 |
1.294.410 |
|
|
|
|
|
|
|
|
|
|
|
|
|
|
|
|
| |
2020 |
1.426.881 |
|
|
|
|
|
|
|
|
|
|
|
|
|
|
|
|
|
|
|
|
|
|
| |
Totaal |
|
534.901 |
759.509 |
1.294.410 |
|
|
|
|
|
|
|
|
|
|
|
|
|
|
|
|
|
|
|
| |
|
|
|
|
|
|
|
|
|
|
|
|
|
|
|
|
|
|
|
|
|
|
|
|
|
|
|
|
|
|
|
|
|
|
|
|
|
|
|
|
|
|
|
|
|
|
|
|
|