| |
Sub-Saharaans |
|
|
|
|
|
|
|
|
|
|
|
|
|
|
|
|
| |
|
|
|
|
|
|
|
|
|
|
|
|
|
|
|
|
|
|
|
|
|
|
|
|
| |
|
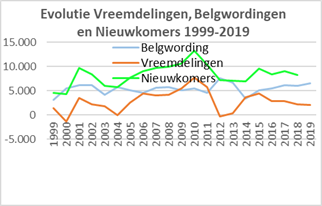
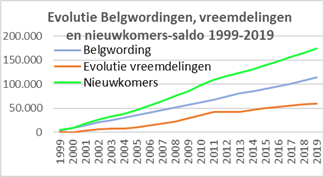
Evolutie
per jaar |
Cumul |
|
Evolutie vreemdelingen 1999-2009: |
28.565 |
|
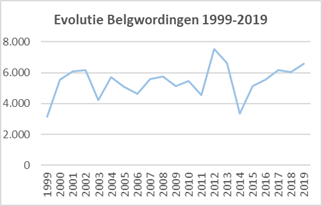
Belgwordingen 1999-2019: |
57.134 |
|
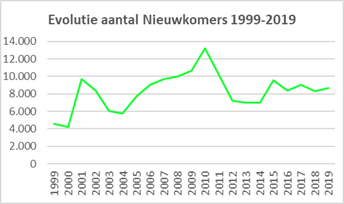
Nieuwkomers 1999-2019: |
85.699 |
|
| |
Jaar op |
Vreem- |
Evol. |
Belg- |
Nieuw- |
Evol. |
Belg- |
Nieuw- |
|
Evolutie vreemdelingen 2010-2019: |
31.638 |
|
Belgwordingen 1999-2019: |
57.016 |
|
Nieuwkomers 2010-2019: |
88.654 |
|
| |
01/01 |
delin- |
vreem- |
wor- |
komers- |
vreem- |
wor- |
komers- |
|
Evolutie vreemdelingen 1999-2019: |
60.203 |
|
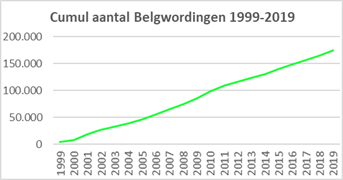
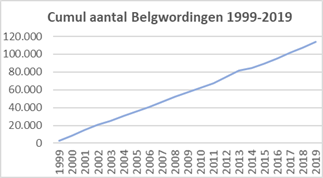
Belgwordingen 1999-2019: |
114.150 |
|
Nieuwkomers 1999-2019: |
174.353 |
|
| |
|
gen |
deling |
dingen |
saldo |
deling |
dingen |
saldo |
|
|
|
|
|
|
|
|
|
|
|
|
|
|
|
|
| |
1999 |
30.426 |
1.400 |
3.147 |
4.547 |
1.400 |
3.147 |
4.547 |
|
|
|
|
|
|
|
|
|
|
|
|
|
|
|
|
| |
2000 |
31.826 |
-1.288 |
5.530 |
4.242 |
112 |
8.677 |
8.789 |
|
|
|
|
|
|
|
|
|
|
|
|
|
|
|
|
| |
2001 |
30.538 |
3.559 |
6.102 |
9.661 |
3.671 |
14.779 |
18.450 |
|
|
|
|
|
|
|
|
|
|
|
|
|
|
|
|
| |
2002 |
34.097 |
2.223 |
6.179 |
8.402 |
5.894 |
20.958 |
26.852 |
|
|
|
|
|
|
|
|
|
|
|
|
|
|
|
|
| |
2003 |
36.320 |
1.811 |
4.226 |
6.037 |
7.705 |
25.184 |
32.889 |
|
|
|
|
|
|
|
|
|
|
|
|
|
|
|
|
| |
2004 |
38.131 |
1 |
5.729 |
5.730 |
7.706 |
30.913 |
38.619 |
|
|
|
|
|
|
|
|
|
|
|
|
|
|
|
|
| |
2005 |
38.132 |
2.643 |
5.098 |
7.741 |
10.349 |
36.011 |
46.360 |
|
|
|
|
|
|
|
|
|
|
|
|
|
|
|
|
| |
2006 |
40.775 |
4.388 |
4.630 |
9.018 |
14.737 |
40.641 |
55.378 |
|
|
|
|
|
|
|
|
|
|
|
|
|
|
|
|
| |
2007 |
45.163 |
4.074 |
5.607 |
9.681 |
18.811 |
46.248 |
65.059 |
|
|
|
|
|
|
|
|
|
|
|
|
|
|
|
|
| |
2008 |
49.237 |
4.224 |
5.760 |
9.984 |
23.035 |
52.008 |
75.043 |
|
|
|
|
|
|
|
|
|
|
|
|
|
|
|
|
| |
2009 |
53.461 |
5.530 |
5.126 |
10.656 |
28.565 |
57.134 |
85.699 |
|
|
|
|
|
|
|
|
|
|
|
|
|
|
|
|
| |
2010 |
58.991 |
7.752 |
5.469 |
13.221 |
36.317 |
62.603 |
98.920 |
|
|
|
|
|
|
|
|
|
|
|
|
|
|
|
|
| |
2011 |
66.743 |
5.758 |
4.543 |
10.301 |
42.075 |
67.146 |
109.221 |
|
|
|
|
|
|
|
|
|
|
|
|
|
|
|
|
| |
2012 |
72.501 |
-353 |
7.546 |
7.193 |
41.722 |
74.692 |
116.414 |
|
|
|
|
|
|
|
|
|
|
|
|
|
|
|
|
| |
2013 |
72.148 |
380 |
6.629 |
7.009 |
42.102 |
81.321 |
123.423 |
|
|
|
|
|
|
|
|
|
|
|
|
|
|
|
|
| |
2014 |
72.528 |
3.651 |
3.341 |
6.992 |
45.753 |
84.662 |
130.415 |
|
|
|
|
|
|
|
|
|
|
|
|
|
|
|
|
| |
2015 |
76.179 |
4.415 |
5.149 |
9.564 |
50.168 |
89.811 |
139.979 |
|
|
|
|
|
|
|
|
|
|
|
|
|
|
|
|
| |
2016 |
80.594 |
2.822 |
5.530 |
8.352 |
52.990 |
95.341 |
148.331 |
|
|
|
|
|
|
|
|
|
|
|
|
|
|
|
|
| |
2017 |
83.416 |
2.876 |
6.183 |
9.059 |
55.866 |
101.524 |
157.390 |
|
|
|
|
|
|
|
|
|
|
|
|
|
|
|
|
| |
2018 |
86.292 |
2.238 |
6.044 |
8.282 |
58.104 |
107.568 |
165.672 |
|
|
|
|
|
|
|
|
|
|
|
|
|
|
|
|
| |
2019 |
88.530 |
2.099 |
6.582 |
8.681 |
60.203 |
114.150 |
174.353 |
|
|
|
|
|
|
|
|
|
|
|
|
|
|
|
|
| |
2020 |
90.629 |
|
|
|
|
|
|
|
|
|
|
|
|
|
|
|
|
|
|
|
|
|
|
| |
Totaal |
|
60.203 |
114.150 |
174.353 |
|
|
|
|
|
|
|
|
|
|
|
|
|
|
|
|
|
|
|
| |
|
|
|
|
|
|
|
|
|
|
|
|
|
|
|
|
|
|
|
|
|
|
|
|
|
|
|
|
|
|
|
|
|
|
|
|
|
|
|
|
|
|
|
|
|
|
|
|
|