| |
Rwanda |
|
|
|
|
|
|
|
|
|
|
|
|
|
|
|
|
| |
|
|
|
|
|
|
|
|
|
|
|
|
|
|
|
|
|
|
|
|
|
|
|
|
| |
|
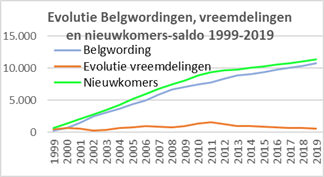
Evolutie
per jaar |
Cumul |
|
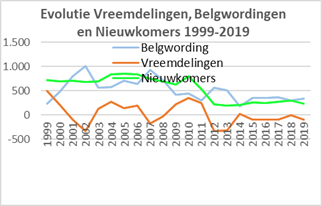
Evolutie vreemdelingen 1999-2009: |
1.023 |
|
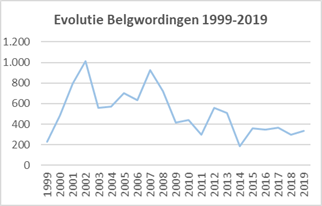
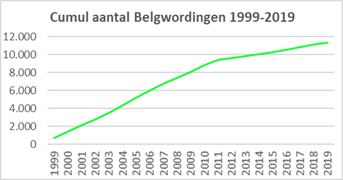
Belgwordingen 1999-2019: |
7.048 |
|
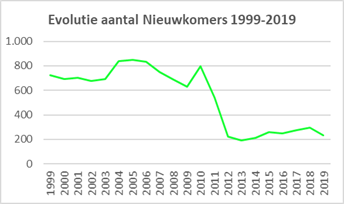
Nieuwkomers 1999-2019: |
8.071 |
|
| |
Jaar op |
Vreem- |
Evol. |
Belg- |
Nieuw- |
Evol. |
Belg- |
Nieuw- |
|
Evolutie vreemdelingen 2010-2019: |
-423 |
|
Belgwordingen 1999-2019: |
3.697 |
|
Nieuwkomers 2010-2019: |
3.274 |
|
| |
01/01 |
delin- |
vreem- |
wor- |
komers- |
vreem- |
wor- |
komers- |
|
Evolutie vreemdelingen 1999-2019: |
600 |
|
Belgwordingen 1999-2019: |
10.745 |
|
Nieuwkomers 1999-2019: |
11.345 |
|
| |
|
gen |
deling |
dingen |
saldo |
deling |
dingen |
saldo |
|
|
|
|
|
|
|
|
|
|
|
|
|
|
|
|
| |
1999 |
2.323 |
493 |
232 |
725 |
493 |
232 |
725 |
|
|
|
|
|
|
|
|
|
|
|
|
|
|
|
|
| |
2000 |
2.816 |
206 |
484 |
690 |
699 |
716 |
1.415 |
|
|
|
|
|
|
|
|
|
|
|
|
|
|
|
|
| |
2001 |
3.022 |
-92 |
794 |
702 |
607 |
1.510 |
2.117 |
|
|
|
|
|
|
|
|
|
|
|
|
|
|
|
|
| |
2002 |
2.930 |
-337 |
1.012 |
675 |
270 |
2.522 |
2.792 |
|
|
|
|
|
|
|
|
|
|
|
|
|
|
|
|
| |
2003 |
2.593 |
133 |
557 |
690 |
403 |
3.079 |
3.482 |
|
|
|
|
|
|
|
|
|
|
|
|
|
|
|
|
| |
2004 |
2.726 |
270 |
571 |
841 |
673 |
3.650 |
4.323 |
|
|
|
|
|
|
|
|
|
|
|
|
|
|
|
|
| |
2005 |
2.996 |
147 |
700 |
847 |
820 |
4.350 |
5.170 |
|
|
|
|
|
|
|
|
|
|
|
|
|
|
|
|
| |
2006 |
3.143 |
198 |
635 |
833 |
1.018 |
4.985 |
6.003 |
|
|
|
|
|
|
|
|
|
|
|
|
|
|
|
|
| |
2007 |
3.341 |
-175 |
924 |
749 |
843 |
5.909 |
6.752 |
|
|
|
|
|
|
|
|
|
|
|
|
|
|
|
|
| |
2008 |
3.166 |
-36 |
723 |
687 |
807 |
6.632 |
7.439 |
|
|
|
|
|
|
|
|
|
|
|
|
|
|
|
|
| |
2009 |
3.130 |
216 |
416 |
632 |
1.023 |
7.048 |
8.071 |
|
|
|
|
|
|
|
|
|
|
|
|
|
|
|
|
| |
2010 |
3.346 |
357 |
442 |
799 |
1.380 |
7.490 |
8.870 |
|
|
|
|
|
|
|
|
|
|
|
|
|
|
|
|
| |
2011 |
3.703 |
242 |
298 |
540 |
1.622 |
7.788 |
9.410 |
|
|
|
|
|
|
|
|
|
|
|
|
|
|
|
|
| |
2012 |
3.945 |
-338 |
558 |
220 |
1.284 |
8.346 |
9.630 |
|
|
|
|
|
|
|
|
|
|
|
|
|
|
|
|
| |
2013 |
3.607 |
-319 |
509 |
190 |
965 |
8.855 |
9.820 |
|
|
|
|
|
|
|
|
|
|
|
|
|
|
|
|
| |
2014 |
3.288 |
28 |
185 |
213 |
993 |
9.040 |
10.033 |
|
|
|
|
|
|
|
|
|
|
|
|
|
|
|
|
| |
2015 |
3.316 |
-101 |
358 |
257 |
892 |
9.398 |
10.290 |
|
|
|
|
|
|
|
|
|
|
|
|
|
|
|
|
| |
2016 |
3.215 |
-99 |
348 |
249 |
793 |
9.746 |
10.539 |
|
|
|
|
|
|
|
|
|
|
|
|
|
|
|
|
| |
2017 |
3.116 |
-91 |
365 |
274 |
702 |
10.111 |
10.813 |
|
|
|
|
|
|
|
|
|
|
|
|
|
|
|
|
| |
2018 |
3.025 |
-2 |
300 |
298 |
700 |
10.411 |
11.111 |
|
|
|
|
|
|
|
|
|
|
|
|
|
|
|
|
| |
2019 |
3.023 |
-100 |
334 |
234 |
600 |
10.745 |
11.345 |
|
|
|
|
|
|
|
|
|
|
|
|
|
|
|
|
| |
2020 |
2.923 |
|
|
|
|
|
|
|
|
|
|
|
|
|
|
|
|
|
|
|
|
|
|
| |
Totaal |
|
600 |
10.745 |
11.345 |
|
|
|
|
|
|
|
|
|
|
|
|
|
|
|
|
|
|
|
| |
|
|
|
|
|
|
|
|
|
|
|
|
|
|
|
|
|
|
|
|
|
|
|
|
|
|
|
|
|
|
|
|
|
|
|
|
|
|
|
|
|
|
|
|
|
|
|
|
|