| |
Portugal |
|
|
|
|
|
|
|
|
|
|
|
|
|
|
|
|
| |
|
|
|
|
|
|
|
|
|
|
|
|
|
|
|
|
|
|
|
|
|
|
|
|
| |
|
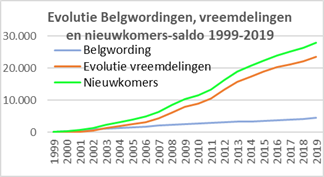
Evolutie
per jaar |
Cumul |
|
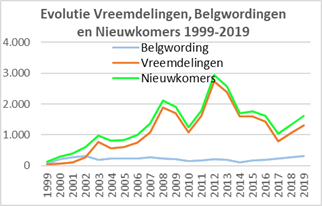
Evolutie vreemdelingen 1999-2009: |
7.873 |
|
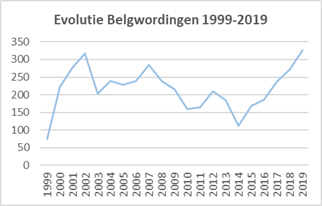
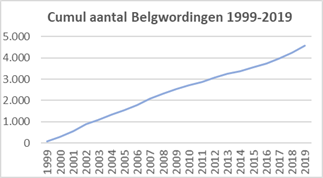
Belgwordingen 1999-2019: |
2.542 |
|
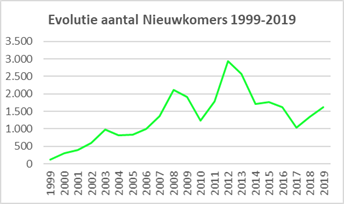
Nieuwkomers 1999-2019: |
10.415 |
|
| |
Jaar op |
Vreem- |
Evol. |
Belg- |
Nieuw- |
Evol. |
Belg- |
Nieuw- |
|
Evolutie vreemdelingen 2010-2019: |
15.596 |
|
Belgwordingen 1999-2019: |
2.023 |
|
Nieuwkomers 2010-2019: |
17.619 |
|
| |
01/01 |
delin- |
vreem- |
wor- |
komers- |
vreem- |
wor- |
komers- |
|
Evolutie vreemdelingen 1999-2019: |
23.469 |
|
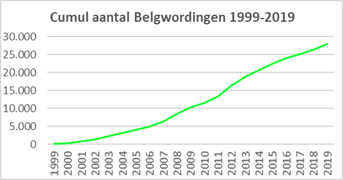
Belgwordingen 1999-2019: |
4.565 |
|
Nieuwkomers 1999-2019: |
28.034 |
|
| |
|
gen |
deling |
dingen |
saldo |
deling |
dingen |
saldo |
|
|
|
|
|
|
|
|
|
|
|
|
|
|
|
|
| |
1999 |
25.510 |
53 |
75 |
128 |
53 |
75 |
128 |
|
|
|
|
|
|
|
|
|
|
|
|
|
|
|
|
| |
2000 |
25.563 |
73 |
223 |
296 |
126 |
298 |
424 |
|
|
|
|
|
|
|
|
|
|
|
|
|
|
|
|
| |
2001 |
25.636 |
119 |
276 |
395 |
245 |
574 |
819 |
|
|
|
|
|
|
|
|
|
|
|
|
|
|
|
|
| |
2002 |
25.755 |
280 |
318 |
598 |
525 |
892 |
1.417 |
|
|
|
|
|
|
|
|
|
|
|
|
|
|
|
|
| |
2003 |
26.035 |
768 |
203 |
971 |
1.293 |
1.095 |
2.388 |
|
|
|
|
|
|
|
|
|
|
|
|
|
|
|
|
| |
2004 |
26.803 |
571 |
240 |
811 |
1.864 |
1.335 |
3.199 |
|
|
|
|
|
|
|
|
|
|
|
|
|
|
|
|
| |
2005 |
27.374 |
602 |
229 |
831 |
2.466 |
1.564 |
4.030 |
|
|
|
|
|
|
|
|
|
|
|
|
|
|
|
|
| |
2006 |
27.976 |
750 |
239 |
989 |
3.216 |
1.803 |
5.019 |
|
|
|
|
|
|
|
|
|
|
|
|
|
|
|
|
| |
2007 |
28.726 |
1.076 |
284 |
1.360 |
4.292 |
2.087 |
6.379 |
|
|
|
|
|
|
|
|
|
|
|
|
|
|
|
|
| |
2008 |
29.802 |
1.879 |
240 |
2.119 |
6.171 |
2.327 |
8.498 |
|
|
|
|
|
|
|
|
|
|
|
|
|
|
|
|
| |
2009 |
31.681 |
1.702 |
215 |
1.917 |
7.873 |
2.542 |
10.415 |
|
|
|
|
|
|
|
|
|
|
|
|
|
|
|
|
| |
2010 |
33.383 |
1.081 |
159 |
1.240 |
8.954 |
2.701 |
11.655 |
|
|
|
|
|
|
|
|
|
|
|
|
|
|
|
|
| |
2011 |
34.464 |
1.618 |
165 |
1.783 |
10.572 |
2.866 |
13.438 |
|
|
|
|
|
|
|
|
|
|
|
|
|
|
|
|
| |
2012 |
36.082 |
2.730 |
211 |
2.941 |
13.302 |
3.077 |
16.379 |
|
|
|
|
|
|
|
|
|
|
|
|
|
|
|
|
| |
2013 |
38.812 |
2.387 |
185 |
2.572 |
15.689 |
3.262 |
18.951 |
|
|
|
|
|
|
|
|
|
|
|
|
|
|
|
|
| |
2014 |
41.199 |
1.594 |
112 |
1.706 |
17.283 |
3.374 |
20.657 |
|
|
|
|
|
|
|
|
|
|
|
|
|
|
|
|
| |
2015 |
42.793 |
1.593 |
169 |
1.762 |
18.876 |
3.543 |
22.419 |
|
|
|
|
|
|
|
|
|
|
|
|
|
|
|
|
| |
2016 |
44.386 |
1.430 |
186 |
1.616 |
20.306 |
3.729 |
24.035 |
|
|
|
|
|
|
|
|
|
|
|
|
|
|
|
|
| |
2017 |
45.816 |
795 |
238 |
1.033 |
21.101 |
3.967 |
25.068 |
|
|
|
|
|
|
|
|
|
|
|
|
|
|
|
|
| |
2018 |
46.611 |
1.066 |
272 |
1.338 |
22.167 |
4.239 |
26.406 |
|
|
|
|
|
|
|
|
|
|
|
|
|
|
|
|
| |
2019 |
47.677 |
1.302 |
326 |
1.628 |
23.469 |
4.565 |
28.034 |
|
|
|
|
|
|
|
|
|
|
|
|
|
|
|
|
| |
2020 |
48.979 |
|
|
|
|
|
|
|
|
|
|
|
|
|
|
|
|
|
|
|
|
|
|
| |
Totaal |
|
23.469 |
4.565 |
28.034 |
|
|
|
|
|
|
|
|
|
|
|
|
|
|
|
|
|
|
|
| |
|
|
|
|
|
|
|
|
|
|
|
|
|
|
|
|
|
|
|
|
|
|
|
|
|
|
|
|
|
|
|
|
|
|
|
|
|
|
|
|
|
|
|
|
|
|
|
|
|