| |
Polen |
|
|
|
|
|
|
|
|
|
|
|
|
|
|
|
|
| |
|
|
|
|
|
|
|
|
|
|
|
|
|
|
|
|
|
|
|
|
|
|
|
|
| |
|
Evolutie
per jaar |
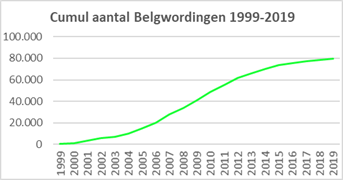
Cumul |
|
Evolutie vreemdelingen 1999-2009: |
35.378 |
|
Belgwordingen 1999-2019: |
5.843 |
|
Nieuwkomers 1999-2019: |
41.221 |
|
| |
Jaar op |
Vreem- |
Evol. |
Belg- |
Nieuw- |
Evol. |
Belg- |
Nieuw- |
|
Evolutie vreemdelingen 2010-2019: |
27.885 |
|
Belgwordingen 1999-2019: |
10.391 |
|
Nieuwkomers 2010-2019: |
38.276 |
|
| |
01/01 |
delin- |
vreem- |
wor- |
komers- |
vreem- |
wor- |
komers- |
|
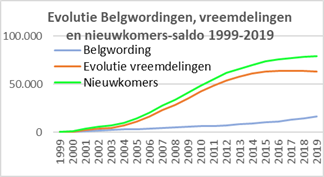
Evolutie vreemdelingen 1999-2019: |
63.263 |
|
Belgwordingen 1999-2019: |
16.234 |
|
Nieuwkomers 1999-2019: |
79.497 |
|
| |
|
gen |
deling |
dingen |
saldo |
deling |
dingen |
saldo |
|
|
|
|
|
|
|
|
|
|
|
|
|
|
|
|
| |
1999 |
7.408 |
352 |
253 |
605 |
352 |
253 |
605 |
|
|
|
|
|
|
|
|
|
|
|
|
|
|
|
|
| |
2000 |
7.760 |
40 |
492 |
532 |
392 |
745 |
1.137 |
|
|
|
|
|
|
|
|
|
|
|
|
|
|
|
|
| |
2001 |
7.800 |
1.833 |
678 |
2.511 |
2.225 |
1.423 |
3.648 |
|
|
|
|
|
|
|
|
|
|
|
|
|
|
|
|
| |
2002 |
9.633 |
1.389 |
630 |
2.019 |
3.614 |
2.053 |
5.667 |
|
|
|
|
|
|
|
|
|
|
|
|
|
|
|
|
| |
2003 |
11.022 |
1.142 |
460 |
1.602 |
4.756 |
2.513 |
7.269 |
|
|
|
|
|
|
|
|
|
|
|
|
|
|
|
|
| |
2004 |
12.164 |
2.357 |
465 |
2.822 |
7.113 |
2.978 |
10.091 |
|
|
|
|
|
|
|
|
|
|
|
|
|
|
|
|
| |
2005 |
14.521 |
3.988 |
470 |
4.458 |
11.101 |
3.448 |
14.549 |
|
|
|
|
|
|
|
|
|
|
|
|
|
|
|
|
| |
2006 |
18.509 |
5.135 |
550 |
5.685 |
16.236 |
3.998 |
20.234 |
|
|
|
|
|
|
|
|
|
|
|
|
|
|
|
|
| |
2007 |
23.644 |
7.124 |
586 |
7.710 |
23.360 |
4.584 |
27.944 |
|
|
|
|
|
|
|
|
|
|
|
|
|
|
|
|
| |
2008 |
30.768 |
5.491 |
619 |
6.110 |
28.851 |
5.203 |
34.054 |
|
|
|
|
|
|
|
|
|
|
|
|
|
|
|
|
| |
2009 |
36.259 |
6.527 |
640 |
7.167 |
35.378 |
5.843 |
41.221 |
|
|
|
|
|
|
|
|
|
|
|
|
|
|
|
|
| |
2010 |
42.786 |
6.875 |
523 |
7.398 |
42.253 |
6.366 |
48.619 |
|
|
|
|
|
|
|
|
|
|
|
|
|
|
|
|
| |
2011 |
49.661 |
6.414 |
394 |
6.808 |
48.667 |
6.760 |
55.427 |
|
|
|
|
|
|
|
|
|
|
|
|
|
|
|
|
| |
2012 |
56.075 |
5.449 |
729 |
6.178 |
54.116 |
7.489 |
61.605 |
|
|
|
|
|
|
|
|
|
|
|
|
|
|
|
|
| |
2013 |
61.524 |
3.546 |
888 |
4.434 |
57.662 |
8.377 |
66.039 |
|
|
|
|
|
|
|
|
|
|
|
|
|
|
|
|
| |
2014 |
65.070 |
3.333 |
742 |
4.075 |
60.995 |
9.119 |
70.114 |
|
|
|
|
|
|
|
|
|
|
|
|
|
|
|
|
| |
2015 |
68.403 |
2.363 |
1.136 |
3.499 |
63.358 |
10.255 |
73.613 |
|
|
|
|
|
|
|
|
|
|
|
|
|
|
|
|
| |
2016 |
70.766 |
691 |
1.243 |
1.934 |
64.049 |
11.498 |
75.547 |
|
|
|
|
|
|
|
|
|
|
|
|
|
|
|
|
| |
2017 |
71.457 |
80 |
1.498 |
1.578 |
64.129 |
12.996 |
77.125 |
|
|
|
|
|
|
|
|
|
|
|
|
|
|
|
|
| |
2018 |
71.537 |
-206 |
1.528 |
1.322 |
63.923 |
14.524 |
78.447 |
|
|
|
|
|
|
|
|
|
|
|
|
|
|
|
|
| |
2019 |
71.331 |
-660 |
1.710 |
1.050 |
63.263 |
16.234 |
79.497 |
|
|
|
|
|
|
|
|
|
|
|
|
|
|
|
|
| |
2020 |
70.671 |
|
|
|
|
|
|
|
|
|
|
|
|
|
|
|
|
|
|
|
|
|
|
| |
Totaal |
|
63.263 |
16.234 |
79.497 |
|
|
|
|
|
|
|
|
|
|
|
|
|
|
|
|
|
|
|
| |
|
|
|
|
|
|
|
|
|
|
|
|
|
|
|
|
|
|
|
|
|
|
|
|
|
|
|
|
|
|
|
|
|
|
|
|
|
|
|
|
|
|
|
|
|
|
|
|
|