| |
Oost-Europa |
|
|
|
|
|
|
|
|
|
|
|
|
|
|
|
|
| |
|
|
|
|
|
|
|
|
|
|
|
|
|
|
|
|
|
|
|
|
|
|
|
|
| |
|
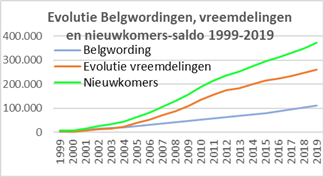
Evolutie
per jaar |
Cumul |
|
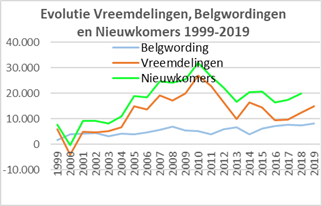
Evolutie vreemdelingen 1999-2009: |
108.227 |
|
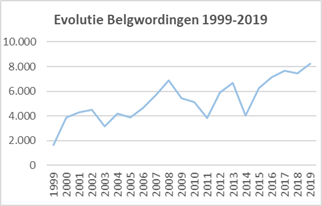
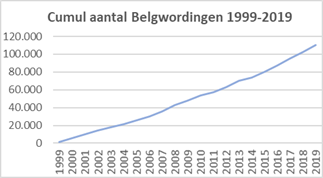
Belgwordingen 1999-2019: |
48.312 |
|
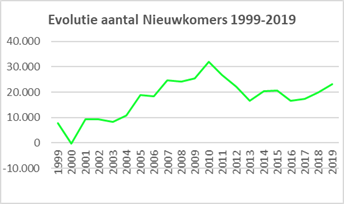
Nieuwkomers 1999-2019: |
156.539 |
|
| |
Jaar op |
Vreem- |
Evol. |
Belg- |
Nieuw- |
Evol. |
Belg- |
Nieuw- |
|
Evolutie vreemdelingen 2010-2019: |
153.298 |
|
Belgwordingen 1999-2019: |
62.333 |
|
Nieuwkomers 2010-2019: |
215.631 |
|
| |
01/01 |
delin- |
vreem- |
wor- |
komers- |
vreem- |
wor- |
komers- |
|
Evolutie vreemdelingen 1999-2019: |
261.525 |
|
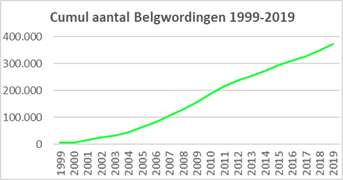
Belgwordingen 1999-2019: |
110.645 |
|
Nieuwkomers 1999-2019: |
372.170 |
|
| |
|
gen |
deling |
dingen |
saldo |
deling |
dingen |
saldo |
|
|
|
|
|
|
|
|
|
|
|
|
|
|
|
|
| |
1999 |
28.592 |
6.014 |
1.671 |
7.685 |
6.014 |
1.671 |
7.685 |
|
|
|
|
|
|
|
|
|
|
|
|
|
|
|
|
| |
2000 |
34.606 |
-4.181 |
3.895 |
-286 |
1.833 |
5.566 |
7.399 |
|
|
|
|
|
|
|
|
|
|
|
|
|
|
|
|
| |
2001 |
30.425 |
4.919 |
4.297 |
9.216 |
6.752 |
9.863 |
16.615 |
|
|
|
|
|
|
|
|
|
|
|
|
|
|
|
|
| |
2002 |
35.344 |
4.705 |
4.507 |
9.212 |
11.457 |
14.370 |
25.827 |
|
|
|
|
|
|
|
|
|
|
|
|
|
|
|
|
| |
2003 |
40.049 |
5.129 |
3.152 |
8.281 |
16.586 |
17.522 |
34.108 |
|
|
|
|
|
|
|
|
|
|
|
|
|
|
|
|
| |
2004 |
45.178 |
6.650 |
4.201 |
10.851 |
23.236 |
21.723 |
44.959 |
|
|
|
|
|
|
|
|
|
|
|
|
|
|
|
|
| |
2005 |
51.828 |
15.008 |
3.898 |
18.906 |
38.244 |
25.621 |
63.865 |
|
|
|
|
|
|
|
|
|
|
|
|
|
|
|
|
| |
2006 |
66.836 |
13.645 |
4.652 |
18.297 |
51.889 |
30.273 |
82.162 |
|
|
|
|
|
|
|
|
|
|
|
|
|
|
|
|
| |
2007 |
80.481 |
19.061 |
5.709 |
24.770 |
70.950 |
35.982 |
106.932 |
|
|
|
|
|
|
|
|
|
|
|
|
|
|
|
|
| |
2008 |
99.542 |
17.232 |
6.910 |
24.142 |
88.182 |
42.892 |
131.074 |
|
|
|
|
|
|
|
|
|
|
|
|
|
|
|
|
| |
2009 |
116.774 |
20.045 |
5.420 |
25.465 |
108.227 |
48.312 |
156.539 |
|
|
|
|
|
|
|
|
|
|
|
|
|
|
|
|
| |
2010 |
136.819 |
26.799 |
5.131 |
31.930 |
135.026 |
53.443 |
188.469 |
|
|
|
|
|
|
|
|
|
|
|
|
|
|
|
|
| |
2011 |
163.618 |
22.886 |
3.835 |
26.721 |
157.912 |
57.278 |
215.190 |
|
|
|
|
|
|
|
|
|
|
|
|
|
|
|
|
| |
2012 |
186.504 |
16.377 |
5.881 |
22.258 |
174.289 |
63.159 |
237.448 |
|
|
|
|
|
|
|
|
|
|
|
|
|
|
|
|
| |
2013 |
202.881 |
9.911 |
6.696 |
16.607 |
184.200 |
69.855 |
254.055 |
|
|
|
|
|
|
|
|
|
|
|
|
|
|
|
|
| |
2014 |
212.792 |
16.348 |
4.052 |
20.400 |
200.548 |
73.907 |
274.455 |
|
|
|
|
|
|
|
|
|
|
|
|
|
|
|
|
| |
2015 |
229.140 |
14.472 |
6.253 |
20.725 |
215.020 |
80.160 |
295.180 |
|
|
|
|
|
|
|
|
|
|
|
|
|
|
|
|
| |
2016 |
243.612 |
9.400 |
7.126 |
16.526 |
224.420 |
87.286 |
311.706 |
|
|
|
|
|
|
|
|
|
|
|
|
|
|
|
|
| |
2017 |
253.012 |
9.752 |
7.678 |
17.430 |
234.172 |
94.964 |
329.136 |
|
|
|
|
|
|
|
|
|
|
|
|
|
|
|
|
| |
2018 |
262.764 |
12.386 |
7.466 |
19.852 |
246.558 |
102.429 |
348.987 |
|
|
|
|
|
|
|
|
|
|
|
|
|
|
|
|
| |
2019 |
275.150 |
14.967 |
8.215 |
23.182 |
261.525 |
110.645 |
372.170 |
|
|
|
|
|
|
|
|
|
|
|
|
|
|
|
|
| |
2020 |
290.117 |
|
|
|
|
|
|
|
|
|
|
|
|
|
|
|
|
|
|
|
|
|
|
| |
Totaal |
|
261.525 |
110.645 |
372.170 |
|
|
|
|
|
|
|
|
|
|
|
|
|
|
|
|
|
|
|
| |
|
|
|
|
|
|
|
|
|
|
|
|
|
|
|
|
|
|
|
|
|
|
|
|
|
|
|
|
|
|
|
|
|
|
|
|
|
|
|
|
|
|
|
|
|
|
|
|
|