| |
Nederland |
|
|
|
|
|
|
|
|
|
|
|
|
|
|
|
|
| |
|
|
|
|
|
|
|
|
|
|
|
|
|
|
|
|
|
|
|
|
|
|
|
|
| |
|
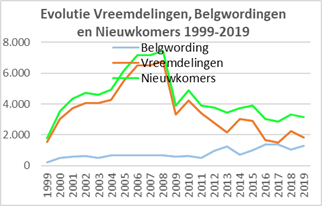
Evolutie
per jaar |
Cumul |
|
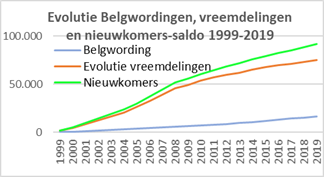
Evolutie vreemdelingen 1999-2009: |
49.323 |
|
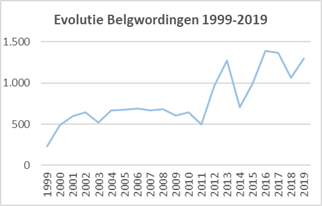
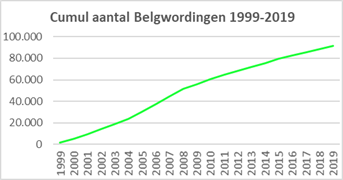
Belgwordingen 1999-2019: |
6.483 |
|
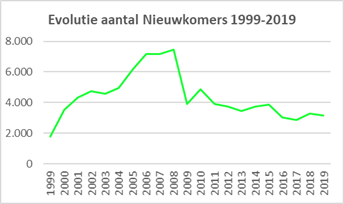
Nieuwkomers 1999-2019: |
55.806 |
|
| |
Jaar op |
Vreem- |
Evol. |
Belg- |
Nieuw- |
Evol. |
Belg- |
Nieuw- |
|
Evolutie vreemdelingen 2010-2019: |
25.783 |
|
Belgwordingen 1999-2019: |
10.185 |
|
Nieuwkomers 2010-2019: |
35.968 |
|
| |
01/01 |
delin- |
vreem- |
wor- |
komers- |
vreem- |
wor- |
komers- |
|
Evolutie vreemdelingen 1999-2019: |
75.106 |
|
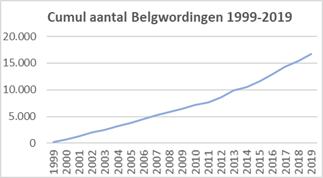
Belgwordingen 1999-2019: |
16.668 |
|
Nieuwkomers 1999-2019: |
91.774 |
|
| |
|
gen |
deling |
dingen |
saldo |
deling |
dingen |
saldo |
|
|
|
|
|
|
|
|
|
|
|
|
|
|
|
|
| |
1999 |
84.213 |
1.550 |
234 |
1.784 |
1.550 |
234 |
1.784 |
|
|
|
|
|
|
|
|
|
|
|
|
|
|
|
|
| |
2000 |
85.763 |
3.050 |
492 |
3.542 |
4.600 |
726 |
5.326 |
|
|
|
|
|
|
|
|
|
|
|
|
|
|
|
|
| |
2001 |
88.813 |
3.748 |
601 |
4.349 |
8.348 |
1.327 |
9.675 |
|
|
|
|
|
|
|
|
|
|
|
|
|
|
|
|
| |
2002 |
92.561 |
4.082 |
646 |
4.728 |
12.430 |
1.973 |
14.403 |
|
|
|
|
|
|
|
|
|
|
|
|
|
|
|
|
| |
2003 |
96.643 |
4.057 |
522 |
4.579 |
16.487 |
2.495 |
18.982 |
|
|
|
|
|
|
|
|
|
|
|
|
|
|
|
|
| |
2004 |
100.700 |
4.278 |
665 |
4.943 |
20.765 |
3.160 |
23.925 |
|
|
|
|
|
|
|
|
|
|
|
|
|
|
|
|
| |
2005 |
104.978 |
5.514 |
672 |
6.186 |
26.279 |
3.832 |
30.111 |
|
|
|
|
|
|
|
|
|
|
|
|
|
|
|
|
| |
2006 |
110.492 |
6.478 |
692 |
7.170 |
32.757 |
4.524 |
37.281 |
|
|
|
|
|
|
|
|
|
|
|
|
|
|
|
|
| |
2007 |
116.970 |
6.484 |
668 |
7.152 |
39.241 |
5.192 |
44.433 |
|
|
|
|
|
|
|
|
|
|
|
|
|
|
|
|
| |
2008 |
123.454 |
6.776 |
683 |
7.459 |
46.017 |
5.875 |
51.892 |
|
|
|
|
|
|
|
|
|
|
|
|
|
|
|
|
| |
2009 |
130.230 |
3.306 |
608 |
3.914 |
49.323 |
6.483 |
55.806 |
|
|
|
|
|
|
|
|
|
|
|
|
|
|
|
|
| |
2010 |
133.536 |
4.244 |
641 |
4.885 |
53.567 |
7.124 |
60.691 |
|
|
|
|
|
|
|
|
|
|
|
|
|
|
|
|
| |
2011 |
137.780 |
3.398 |
495 |
3.893 |
56.965 |
7.619 |
64.584 |
|
|
|
|
|
|
|
|
|
|
|
|
|
|
|
|
| |
2012 |
141.178 |
2.799 |
961 |
3.760 |
59.764 |
8.580 |
68.344 |
|
|
|
|
|
|
|
|
|
|
|
|
|
|
|
|
| |
2013 |
143.977 |
2.178 |
1.272 |
3.450 |
61.942 |
9.852 |
71.794 |
|
|
|
|
|
|
|
|
|
|
|
|
|
|
|
|
| |
2014 |
146.155 |
3.044 |
705 |
3.749 |
64.986 |
10.557 |
75.543 |
|
|
|
|
|
|
|
|
|
|
|
|
|
|
|
|
| |
2015 |
149.199 |
2.885 |
993 |
3.878 |
67.871 |
11.550 |
79.421 |
|
|
|
|
|
|
|
|
|
|
|
|
|
|
|
|
| |
2016 |
152.084 |
1.652 |
1.390 |
3.042 |
69.523 |
12.940 |
82.463 |
|
|
|
|
|
|
|
|
|
|
|
|
|
|
|
|
| |
2017 |
153.736 |
1.503 |
1.368 |
2.871 |
71.026 |
14.308 |
85.334 |
|
|
|
|
|
|
|
|
|
|
|
|
|
|
|
|
| |
2018 |
155.239 |
2.235 |
1.064 |
3.299 |
73.261 |
15.372 |
88.633 |
|
|
|
|
|
|
|
|
|
|
|
|
|
|
|
|
| |
2019 |
157.474 |
1.845 |
1.296 |
3.141 |
75.106 |
16.668 |
91.774 |
|
|
|
|
|
|
|
|
|
|
|
|
|
|
|
|
| |
2020 |
159.319 |
|
|
|
|
|
|
|
|
|
|
|
|
|
|
|
|
|
|
|
|
|
|
| |
Totaal |
|
75.106 |
16.668 |
91.774 |
|
|
|
|
|
|
|
|
|
|
|
|
|
|
|
|
|
|
|
| |
|
|
|
|
|
|
|
|
|
|
|
|
|
|
|
|
|
|
|
|
|
|
|
|
|
|
|
|
|
|
|
|
|
|
|
|
|
|
|
|
|
|
|
|
|
|
|
|
|