| |
Marokko |
|
|
|
|
|
|
|
|
|
|
|
|
|
|
|
|
| |
|
|
|
|
|
|
|
|
|
|
|
|
|
|
|
|
|
|
|
|
|
|
|
|
| |
|
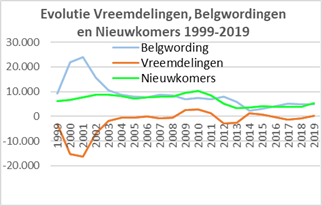
Evolutie
per jaar |
Cumul |
|
Evolutie vreemdelingen 1999-2009: |
-43.160 |
|
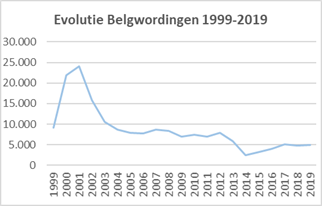
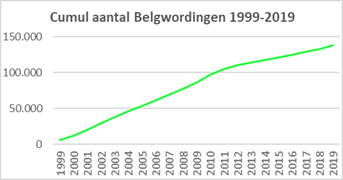
Belgwordingen 1999-2019: |
129.968 |
|
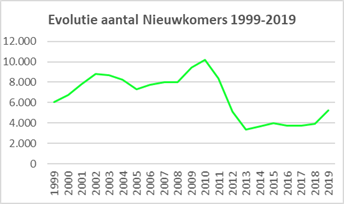
Nieuwkomers 1999-2019: |
86.808 |
|
| |
Jaar op |
Vreem- |
Evol. |
Belg- |
Nieuw- |
Evol. |
Belg- |
Nieuw- |
|
Evolutie vreemdelingen 2010-2019: |
-1.364 |
|
Belgwordingen 1999-2019: |
52.709 |
|
Nieuwkomers 2010-2019: |
51.345 |
|
| |
01/01 |
delin- |
vreem- |
wor- |
komers- |
vreem- |
wor- |
komers- |
|
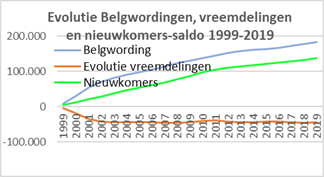
Evolutie vreemdelingen 1999-2019: |
-44.524 |
|
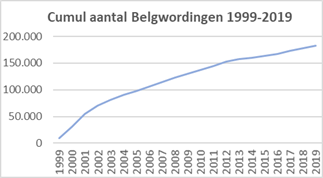
Belgwordingen 1999-2019: |
182.677 |
|
Nieuwkomers 1999-2019: |
138.153 |
|
| |
|
gen |
deling |
dingen |
saldo |
deling |
dingen |
saldo |
|
|
|
|
|
|
|
|
|
|
|
|
|
|
|
|
| |
1999 |
125.103 |
-3.098 |
9.133 |
6.035 |
-3.098 |
9.133 |
6.035 |
|
|
|
|
|
|
|
|
|
|
|
|
|
|
|
|
| |
2000 |
122.005 |
-15.165 |
21.917 |
6.752 |
-18.263 |
31.050 |
12.787 |
|
|
|
|
|
|
|
|
|
|
|
|
|
|
|
|
| |
2001 |
106.840 |
-16.183 |
24.018 |
7.835 |
-34.446 |
55.068 |
20.622 |
|
|
|
|
|
|
|
|
|
|
|
|
|
|
|
|
| |
2002 |
90.657 |
-7.016 |
15.832 |
8.816 |
-41.462 |
70.900 |
29.438 |
|
|
|
|
|
|
|
|
|
|
|
|
|
|
|
|
| |
2003 |
83.641 |
-1.870 |
10.565 |
8.695 |
-43.332 |
81.465 |
38.133 |
|
|
|
|
|
|
|
|
|
|
|
|
|
|
|
|
| |
2004 |
81.771 |
-484 |
8.704 |
8.220 |
-43.816 |
90.169 |
46.353 |
|
|
|
|
|
|
|
|
|
|
|
|
|
|
|
|
| |
2005 |
81.287 |
-678 |
7.977 |
7.299 |
-44.494 |
98.146 |
53.652 |
|
|
|
|
|
|
|
|
|
|
|
|
|
|
|
|
| |
2006 |
80.609 |
-22 |
7.753 |
7.731 |
-44.516 |
105.899 |
61.383 |
|
|
|
|
|
|
|
|
|
|
|
|
|
|
|
|
| |
2007 |
80.587 |
-720 |
8.723 |
8.003 |
-45.236 |
114.622 |
69.386 |
|
|
|
|
|
|
|
|
|
|
|
|
|
|
|
|
| |
2008 |
79.867 |
-441 |
8.427 |
7.986 |
-45.677 |
123.049 |
77.372 |
|
|
|
|
|
|
|
|
|
|
|
|
|
|
|
|
| |
2009 |
79.426 |
2.517 |
6.919 |
9.436 |
-43.160 |
129.968 |
86.808 |
|
|
|
|
|
|
|
|
|
|
|
|
|
|
|
|
| |
2010 |
81.943 |
2.792 |
7.380 |
10.172 |
-40.368 |
137.348 |
96.980 |
|
|
|
|
|
|
|
|
|
|
|
|
|
|
|
|
| |
2011 |
84.735 |
1.319 |
7.035 |
8.354 |
-39.049 |
144.383 |
105.334 |
|
|
|
|
|
|
|
|
|
|
|
|
|
|
|
|
| |
2012 |
86.054 |
-2.784 |
7.879 |
5.095 |
-41.833 |
152.262 |
110.429 |
|
|
|
|
|
|
|
|
|
|
|
|
|
|
|
|
| |
2013 |
83.270 |
-2.550 |
5.926 |
3.376 |
-44.383 |
158.188 |
113.805 |
|
|
|
|
|
|
|
|
|
|
|
|
|
|
|
|
| |
2014 |
80.720 |
1.289 |
2.408 |
3.697 |
-43.094 |
160.596 |
117.502 |
|
|
|
|
|
|
|
|
|
|
|
|
|
|
|
|
| |
2015 |
82.009 |
808 |
3.170 |
3.978 |
-42.286 |
163.766 |
121.480 |
|
|
|
|
|
|
|
|
|
|
|
|
|
|
|
|
| |
2016 |
82.817 |
-231 |
3.996 |
3.765 |
-42.517 |
167.762 |
125.245 |
|
|
|
|
|
|
|
|
|
|
|
|
|
|
|
|
| |
2017 |
82.586 |
-1.371 |
5.084 |
3.713 |
-43.888 |
172.846 |
128.958 |
|
|
|
|
|
|
|
|
|
|
|
|
|
|
|
|
| |
2018 |
81.215 |
-920 |
4.856 |
3.936 |
-44.808 |
177.702 |
132.894 |
|
|
|
|
|
|
|
|
|
|
|
|
|
|
|
|
| |
2019 |
80.295 |
284 |
4.975 |
5.259 |
-44.524 |
182.677 |
138.153 |
|
|
|
|
|
|
|
|
|
|
|
|
|
|
|
|
| |
2020 |
80.579 |
|
|
|
|
|
|
|
|
|
|
|
|
|
|
|
|
|
|
|
|
|
|
| |
Totaal |
|
-44.524 |
182.677 |
138.153 |
|
|
|
|
|
|
|
|
|
|
|
|
|
|
|
|
|
|
|
| |
|
|
|
|
|
|
|
|
|
|
|
|
|
|
|
|
|
|
|
|
|
|
|
|
|
|
|
|
|
|
|
|
|
|
|
|
|
|
|
|
|
|
|
|
|
|
|
|
|