| |
Guinee |
|
|
|
|
|
|
|
|
|
|
|
|
|
|
|
|
| |
|
|
|
|
|
|
|
|
|
|
|
|
|
|
|
|
|
|
|
|
|
|
|
|
| |
|
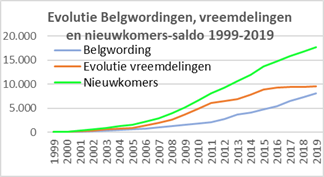
Evolutie
per jaar |
Cumul |
|
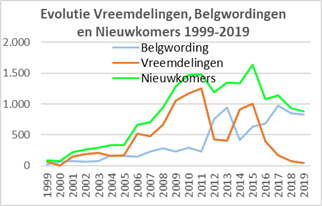
Evolutie vreemdelingen 1999-2009: |
3.666 |
|
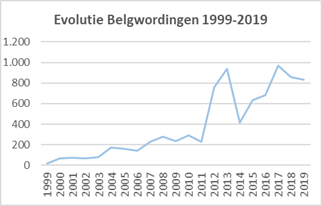
Belgwordingen 1999-2019: |
1.529 |
|
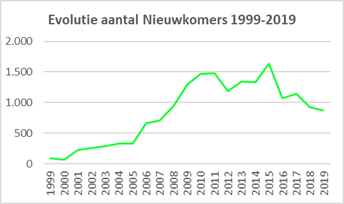
Nieuwkomers 1999-2019: |
5.195 |
|
| |
Jaar op |
Vreem- |
Evol. |
Belg- |
Nieuw- |
Evol. |
Belg- |
Nieuw- |
|
Evolutie vreemdelingen 2010-2019: |
5.870 |
|
Belgwordingen 1999-2019: |
6.608 |
|
Nieuwkomers 2010-2019: |
12.478 |
|
| |
01/01 |
delin- |
vreem- |
wor- |
komers- |
vreem- |
wor- |
komers- |
|
Evolutie vreemdelingen 1999-2019: |
9.536 |
|
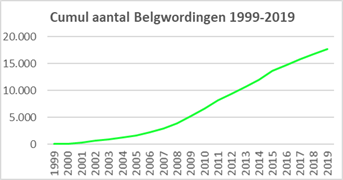
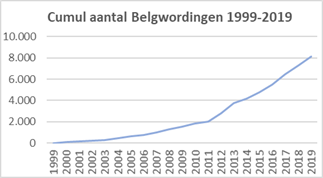
Belgwordingen 1999-2019: |
8.137 |
|
Nieuwkomers 1999-2019: |
17.673 |
|
| |
|
gen |
deling |
dingen |
saldo |
deling |
dingen |
saldo |
|
|
|
|
|
|
|
|
|
|
|
|
|
|
|
|
| |
1999 |
412 |
69 |
20 |
89 |
69 |
20 |
89 |
|
|
|
|
|
|
|
|
|
|
|
|
|
|
|
|
| |
2000 |
481 |
5 |
68 |
73 |
74 |
88 |
162 |
|
|
|
|
|
|
|
|
|
|
|
|
|
|
|
|
| |
2001 |
486 |
147 |
75 |
222 |
221 |
163 |
384 |
|
|
|
|
|
|
|
|
|
|
|
|
|
|
|
|
| |
2002 |
633 |
192 |
68 |
260 |
413 |
231 |
644 |
|
|
|
|
|
|
|
|
|
|
|
|
|
|
|
|
| |
2003 |
825 |
209 |
79 |
288 |
622 |
310 |
932 |
|
|
|
|
|
|
|
|
|
|
|
|
|
|
|
|
| |
2004 |
1.034 |
159 |
173 |
332 |
781 |
483 |
1.264 |
|
|
|
|
|
|
|
|
|
|
|
|
|
|
|
|
| |
2005 |
1.193 |
170 |
162 |
332 |
951 |
645 |
1.596 |
|
|
|
|
|
|
|
|
|
|
|
|
|
|
|
|
| |
2006 |
1.363 |
516 |
144 |
660 |
1.467 |
789 |
2.256 |
|
|
|
|
|
|
|
|
|
|
|
|
|
|
|
|
| |
2007 |
1.879 |
476 |
229 |
705 |
1.943 |
1.018 |
2.961 |
|
|
|
|
|
|
|
|
|
|
|
|
|
|
|
|
| |
2008 |
2.355 |
668 |
278 |
946 |
2.611 |
1.296 |
3.907 |
|
|
|
|
|
|
|
|
|
|
|
|
|
|
|
|
| |
2009 |
3.023 |
1.055 |
233 |
1.288 |
3.666 |
1.529 |
5.195 |
|
|
|
|
|
|
|
|
|
|
|
|
|
|
|
|
| |
2010 |
4.078 |
1.174 |
291 |
1.465 |
4.840 |
1.820 |
6.660 |
|
|
|
|
|
|
|
|
|
|
|
|
|
|
|
|
| |
2011 |
5.252 |
1.256 |
228 |
1.484 |
6.096 |
2.048 |
8.144 |
|
|
|
|
|
|
|
|
|
|
|
|
|
|
|
|
| |
2012 |
6.508 |
431 |
757 |
1.188 |
6.527 |
2.805 |
9.332 |
|
|
|
|
|
|
|
|
|
|
|
|
|
|
|
|
| |
2013 |
6.939 |
407 |
941 |
1.348 |
6.934 |
3.746 |
10.680 |
|
|
|
|
|
|
|
|
|
|
|
|
|
|
|
|
| |
2014 |
7.346 |
916 |
416 |
1.332 |
7.850 |
4.162 |
12.012 |
|
|
|
|
|
|
|
|
|
|
|
|
|
|
|
|
| |
2015 |
8.262 |
1.003 |
635 |
1.638 |
8.853 |
4.797 |
13.650 |
|
|
|
|
|
|
|
|
|
|
|
|
|
|
|
|
| |
2016 |
9.265 |
392 |
681 |
1.073 |
9.245 |
5.478 |
14.723 |
|
|
|
|
|
|
|
|
|
|
|
|
|
|
|
|
| |
2017 |
9.657 |
172 |
972 |
1.144 |
9.417 |
6.450 |
15.867 |
|
|
|
|
|
|
|
|
|
|
|
|
|
|
|
|
| |
2018 |
9.829 |
74 |
855 |
929 |
9.491 |
7.305 |
16.796 |
|
|
|
|
|
|
|
|
|
|
|
|
|
|
|
|
| |
2019 |
9.903 |
45 |
832 |
877 |
9.536 |
8.137 |
17.673 |
|
|
|
|
|
|
|
|
|
|
|
|
|
|
|
|
| |
2020 |
9.948 |
|
|
|
|
|
|
|
|
|
|
|
|
|
|
|
|
|
|
|
|
|
|
| |
Totaal |
|
9.536 |
8.137 |
17.673 |
|
|
|
|
|
|
|
|
|
|
|
|
|
|
|
|
|
|
|
| |
|
|
|
|
|
|
|
|
|
|
|
|
|
|
|
|
|
|
|
|
|
|
|
|
|
|
|
|
|
|
|
|
|
|
|
|
|
|
|
|
|
|
|
|
|
|
|
|
|