| |
Griekenland |
|
|
|
|
|
|
|
|
|
|
|
|
|
|
|
|
| |
|
|
|
|
|
|
|
|
|
|
|
|
|
|
|
|
|
|
|
|
|
|
|
|
| |
|
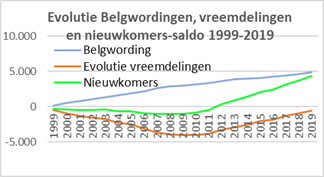
Evolutie
per jaar |
Cumul |
|
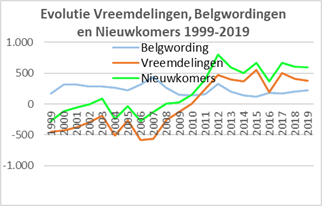
Evolutie vreemdelingen 1999-2009: |
-4.037 |
|
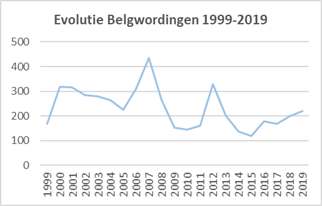
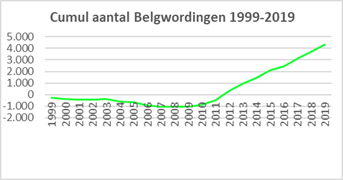
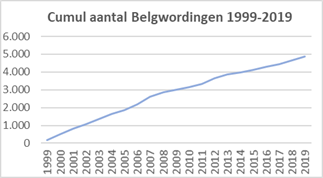
Belgwordingen 1999-2019: |
3.018 |
|
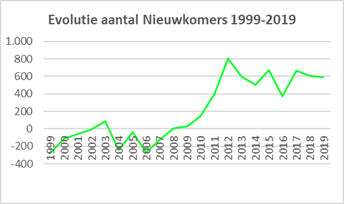
Nieuwkomers 1999-2019: |
-1.019 |
|
| |
Jaar op |
Vreem- |
Evol. |
Belg- |
Nieuw- |
Evol. |
Belg- |
Nieuw- |
|
Evolutie vreemdelingen 2010-2019: |
3.499 |
|
Belgwordingen 1999-2019: |
1.851 |
|
Nieuwkomers 2010-2019: |
5.350 |
|
| |
01/01 |
delin- |
vreem- |
wor- |
komers- |
vreem- |
wor- |
komers- |
|
Evolutie vreemdelingen 1999-2019: |
-538 |
|
Belgwordingen 1999-2019: |
4.869 |
|
Nieuwkomers 1999-2019: |
4.331 |
|
| |
|
gen |
deling |
dingen |
saldo |
deling |
dingen |
saldo |
|
|
|
|
|
|
|
|
|
|
|
|
|
|
|
|
| |
1999 |
18.835 |
-446 |
168 |
-278 |
-446 |
168 |
-278 |
|
|
|
|
|
|
|
|
|
|
|
|
|
|
|
|
| |
2000 |
18.389 |
-433 |
319 |
-114 |
-879 |
487 |
-392 |
|
|
|
|
|
|
|
|
|
|
|
|
|
|
|
|
| |
2001 |
17.956 |
-377 |
317 |
-60 |
-1.256 |
804 |
-452 |
|
|
|
|
|
|
|
|
|
|
|
|
|
|
|
|
| |
2002 |
17.579 |
-290 |
284 |
-6 |
-1.546 |
1.088 |
-458 |
|
|
|
|
|
|
|
|
|
|
|
|
|
|
|
|
| |
2003 |
17.289 |
-192 |
279 |
87 |
-1.738 |
1.367 |
-371 |
|
|
|
|
|
|
|
|
|
|
|
|
|
|
|
|
| |
2004 |
17.097 |
-508 |
265 |
-243 |
-2.246 |
1.632 |
-614 |
|
|
|
|
|
|
|
|
|
|
|
|
|
|
|
|
| |
2005 |
16.589 |
-263 |
226 |
-37 |
-2.509 |
1.858 |
-651 |
|
|
|
|
|
|
|
|
|
|
|
|
|
|
|
|
| |
2006 |
16.326 |
-583 |
310 |
-273 |
-3.092 |
2.168 |
-924 |
|
|
|
|
|
|
|
|
|
|
|
|
|
|
|
|
| |
2007 |
15.743 |
-561 |
434 |
-127 |
-3.653 |
2.602 |
-1.051 |
|
|
|
|
|
|
|
|
|
|
|
|
|
|
|
|
| |
2008 |
15.182 |
-260 |
264 |
4 |
-3.913 |
2.866 |
-1.047 |
|
|
|
|
|
|
|
|
|
|
|
|
|
|
|
|
| |
2009 |
14.922 |
-124 |
152 |
28 |
-4.037 |
3.018 |
-1.019 |
|
|
|
|
|
|
|
|
|
|
|
|
|
|
|
|
| |
2010 |
14.798 |
1 |
144 |
145 |
-4.036 |
3.162 |
-874 |
|
|
|
|
|
|
|
|
|
|
|
|
|
|
|
|
| |
2011 |
14.799 |
241 |
160 |
401 |
-3.795 |
3.322 |
-473 |
|
|
|
|
|
|
|
|
|
|
|
|
|
|
|
|
| |
2012 |
15.040 |
473 |
328 |
801 |
-3.322 |
3.650 |
328 |
|
|
|
|
|
|
|
|
|
|
|
|
|
|
|
|
| |
2013 |
15.513 |
396 |
201 |
597 |
-2.926 |
3.851 |
925 |
|
|
|
|
|
|
|
|
|
|
|
|
|
|
|
|
| |
2014 |
15.909 |
366 |
136 |
502 |
-2.560 |
3.987 |
1.427 |
|
|
|
|
|
|
|
|
|
|
|
|
|
|
|
|
| |
2015 |
16.275 |
551 |
118 |
669 |
-2.009 |
4.105 |
2.096 |
|
|
|
|
|
|
|
|
|
|
|
|
|
|
|
|
| |
2016 |
16.826 |
191 |
178 |
369 |
-1.818 |
4.283 |
2.465 |
|
|
|
|
|
|
|
|
|
|
|
|
|
|
|
|
| |
2017 |
17.017 |
496 |
167 |
663 |
-1.322 |
4.450 |
3.128 |
|
|
|
|
|
|
|
|
|
|
|
|
|
|
|
|
| |
2018 |
17.513 |
408 |
200 |
608 |
-914 |
4.650 |
3.736 |
|
|
|
|
|
|
|
|
|
|
|
|
|
|
|
|
| |
2019 |
17.921 |
376 |
219 |
595 |
-538 |
4.869 |
4.331 |
|
|
|
|
|
|
|
|
|
|
|
|
|
|
|
|
| |
2020 |
18.297 |
|
|
|
|
|
|
|
|
|
|
|
|
|
|
|
|
|
|
|
|
|
|
| |
Totaal |
|
-538 |
4.869 |
4.331 |
|
|
|
|
|
|
|
|
|
|
|
|
|
|
|
|
|
|
|
| |
|
|
|
|
|
|
|
|
|
|
|
|
|
|
|
|
|
|
|
|
|
|
|
|
|
|
|
|
|
|
|
|
|
|
|
|
|
|
|
|
|
|
|
|
|
|
|
|
|