| |
1. Europa |
|
|
|
|
|
|
|
|
|
|
|
|
|
|
|
|
| |
|
|
|
|
|
|
|
|
|
|
|
|
|
|
|
|
|
|
|
|
|
|
|
|
| |
|
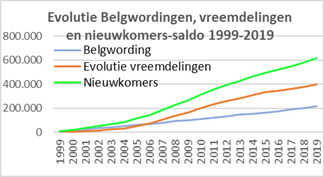
Evolutie
per jaar |
Cumul |
|
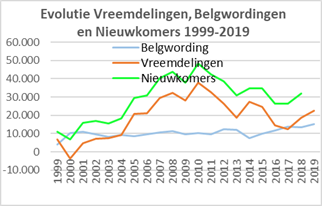
Evolutie vreemdelingen 1999-2009: |
164.132 |
|
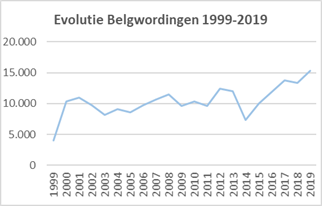
Belgwordingen 1999-2019: |
102.466 |
|
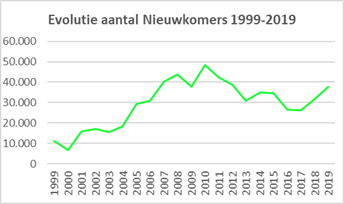
Nieuwkomers 1999-2019: |
266.598 |
|
| |
Jaar op |
Vreem- |
Evol. |
Belg- |
Nieuw- |
Evol. |
Belg- |
Nieuw- |
|
Evolutie vreemdelingen 2010-2019: |
236.380 |
|
Belgwordingen 1999-2019: |
116.027 |
|
Nieuwkomers 2010-2019: |
352.407 |
|
| |
01/01 |
delin- |
vreem- |
wor- |
komers- |
vreem- |
wor- |
komers- |
|
Evolutie vreemdelingen 1999-2019: |
400.512 |
|
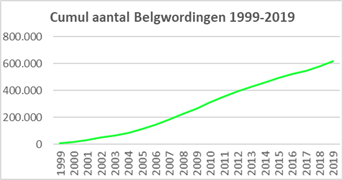
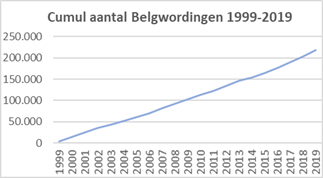
Belgwordingen 1999-2019: |
218.493 |
|
Nieuwkomers 1999-2019: |
619.005 |
|
| |
|
gen |
deling |
dingen |
saldo |
deling |
dingen |
saldo |
|
|
|
|
|
|
|
|
|
|
|
|
|
|
|
|
| |
1999 |
594.915 |
6.981 |
4.048 |
11.029 |
6.981 |
4.048 |
11.029 |
|
|
|
|
|
|
|
|
|
|
|
|
|
|
|
|
| |
2000 |
601.896 |
-3.634 |
10.300 |
6.666 |
3.347 |
14.348 |
17.695 |
|
|
|
|
|
|
|
|
|
|
|
|
|
|
|
|
| |
2001 |
598.262 |
4.903 |
10.974 |
15.877 |
8.250 |
25.322 |
33.572 |
|
|
|
|
|
|
|
|
|
|
|
|
|
|
|
|
| |
2002 |
603.165 |
7.290 |
9.738 |
17.028 |
15.540 |
35.060 |
50.600 |
|
|
|
|
|
|
|
|
|
|
|
|
|
|
|
|
| |
2003 |
610.455 |
7.463 |
8.200 |
15.663 |
23.003 |
43.260 |
66.263 |
|
|
|
|
|
|
|
|
|
|
|
|
|
|
|
|
| |
2004 |
617.918 |
9.359 |
9.100 |
18.459 |
32.362 |
52.360 |
84.722 |
|
|
|
|
|
|
|
|
|
|
|
|
|
|
|
|
| |
2005 |
627.277 |
20.848 |
8.560 |
29.408 |
53.210 |
60.920 |
114.130 |
|
|
|
|
|
|
|
|
|
|
|
|
|
|
|
|
| |
2006 |
648.125 |
20.993 |
9.764 |
30.757 |
74.203 |
70.684 |
144.887 |
|
|
|
|
|
|
|
|
|
|
|
|
|
|
|
|
| |
2007 |
669.118 |
29.649 |
10.683 |
40.332 |
103.852 |
81.367 |
185.219 |
|
|
|
|
|
|
|
|
|
|
|
|
|
|
|
|
| |
2008 |
698.767 |
32.169 |
11.484 |
43.653 |
136.021 |
92.851 |
228.872 |
|
|
|
|
|
|
|
|
|
|
|
|
|
|
|
|
| |
2009 |
730.936 |
28.111 |
9.615 |
37.726 |
164.132 |
102.466 |
266.598 |
|
|
|
|
|
|
|
|
|
|
|
|
|
|
|
|
| |
2010 |
759.047 |
38.026 |
10.297 |
48.323 |
202.158 |
112.763 |
314.921 |
|
|
|
|
|
|
|
|
|
|
|
|
|
|
|
|
| |
2011 |
797.073 |
32.788 |
9.654 |
42.442 |
234.946 |
122.417 |
357.363 |
|
|
|
|
|
|
|
|
|
|
|
|
|
|
|
|
| |
2012 |
829.861 |
26.335 |
12.370 |
38.705 |
261.281 |
134.787 |
396.068 |
|
|
|
|
|
|
|
|
|
|
|
|
|
|
|
|
| |
2013 |
856.196 |
18.824 |
12.031 |
30.855 |
280.105 |
146.818 |
426.923 |
|
|
|
|
|
|
|
|
|
|
|
|
|
|
|
|
| |
2014 |
875.020 |
27.560 |
7.348 |
34.908 |
307.665 |
154.166 |
461.831 |
|
|
|
|
|
|
|
|
|
|
|
|
|
|
|
|
| |
2015 |
902.580 |
24.560 |
10.032 |
34.592 |
332.225 |
164.198 |
496.423 |
|
|
|
|
|
|
|
|
|
|
|
|
|
|
|
|
| |
2016 |
927.140 |
14.539 |
11.863 |
26.402 |
346.764 |
176.061 |
522.825 |
|
|
|
|
|
|
|
|
|
|
|
|
|
|
|
|
| |
2017 |
941.679 |
12.455 |
13.814 |
26.269 |
359.219 |
189.875 |
549.094 |
|
|
|
|
|
|
|
|
|
|
|
|
|
|
|
|
| |
2018 |
954.134 |
18.669 |
13.306 |
31.975 |
377.888 |
203.180 |
581.068 |
|
|
|
|
|
|
|
|
|
|
|
|
|
|
|
|
| |
2019 |
972.803 |
22.624 |
15.313 |
37.937 |
400.512 |
218.493 |
619.005 |
|
|
|
|
|
|
|
|
|
|
|
|
|
|
|
|
| |
2020 |
995.427 |
|
|
|
|
|
|
|
|
|
|
|
|
|
|
|
|
|
|
|
|
|
|
| |
Totaal |
|
400.512 |
218.493 |
619.005 |
|
|
|
|
|
|
|
|
|
|
|
|
|
|
|
|
|
|
|
| |
|
|
|
|
|
|
|
|
|
|
|
|
|
|
|
|
|
|
|
|
|
|
|
|
|
|
|
|
|
|
|
|
|
|
|
|
|
|
|
|
|
|
|
|
|
|
|
|
|