| |
Bulgarije |
|
|
|
|
|
|
|
|
|
|
|
|
|
|
|
|
| |
|
|
|
|
|
|
|
|
|
|
|
|
|
|
|
|
|
|
|
|
|
|
|
|
| |
|
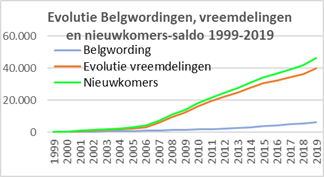
Evolutie
per jaar |
Cumul |
|
Evolutie vreemdelingen 1999-2009: |
12.283 |
|
Belgwordingen 1999-2019: |
1.663 |
|
Nieuwkomers 1999-2019: |
13.946 |
|
| |
Jaar op |
Vreem- |
Evol. |
Belg- |
Nieuw- |
Evol. |
Belg- |
Nieuw- |
|
Evolutie vreemdelingen 2010-2019: |
27.516 |
|
Belgwordingen 1999-2019: |
4.658 |
|
Nieuwkomers 2010-2019: |
32.174 |
|
| |
01/01 |
delin- |
vreem- |
wor- |
komers- |
vreem- |
wor- |
komers- |
|
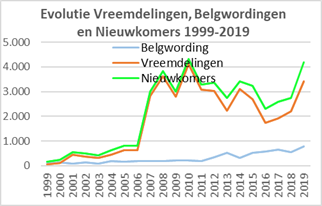
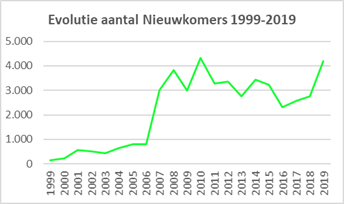
Evolutie vreemdelingen 1999-2019: |
39.799 |
|
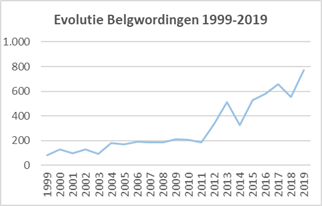
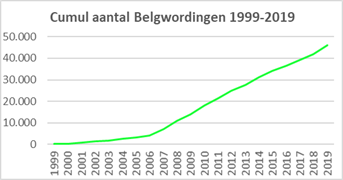
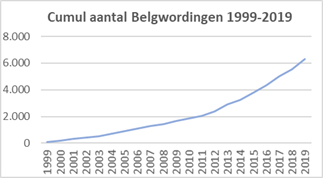
Belgwordingen 1999-2019: |
6.321 |
|
Nieuwkomers 1999-2019: |
46.120 |
|
| |
|
gen |
deling |
dingen |
saldo |
deling |
dingen |
saldo |
|
|
|
|
|
|
|
|
|
|
|
|
|
|
|
|
| |
1999 |
888 |
74 |
80 |
154 |
74 |
80 |
154 |
|
|
|
|
|
|
|
|
|
|
|
|
|
|
|
|
| |
2000 |
962 |
107 |
128 |
235 |
181 |
208 |
389 |
|
|
|
|
|
|
|
|
|
|
|
|
|
|
|
|
| |
2001 |
1.069 |
460 |
99 |
559 |
641 |
307 |
948 |
|
|
|
|
|
|
|
|
|
|
|
|
|
|
|
|
| |
2002 |
1.529 |
378 |
129 |
507 |
1.019 |
436 |
1.455 |
|
|
|
|
|
|
|
|
|
|
|
|
|
|
|
|
| |
2003 |
1.907 |
326 |
95 |
421 |
1.345 |
531 |
1.876 |
|
|
|
|
|
|
|
|
|
|
|
|
|
|
|
|
| |
2004 |
2.233 |
451 |
183 |
634 |
1.796 |
714 |
2.510 |
|
|
|
|
|
|
|
|
|
|
|
|
|
|
|
|
| |
2005 |
2.684 |
628 |
170 |
798 |
2.424 |
884 |
3.308 |
|
|
|
|
|
|
|
|
|
|
|
|
|
|
|
|
| |
2006 |
3.312 |
618 |
193 |
811 |
3.042 |
1.077 |
4.119 |
|
|
|
|
|
|
|
|
|
|
|
|
|
|
|
|
| |
2007 |
3.930 |
2.823 |
185 |
3.008 |
5.865 |
1.262 |
7.127 |
|
|
|
|
|
|
|
|
|
|
|
|
|
|
|
|
| |
2008 |
6.753 |
3.632 |
188 |
3.820 |
9.497 |
1.450 |
10.947 |
|
|
|
|
|
|
|
|
|
|
|
|
|
|
|
|
| |
2009 |
10.385 |
2.786 |
213 |
2.999 |
12.283 |
1.663 |
13.946 |
|
|
|
|
|
|
|
|
|
|
|
|
|
|
|
|
| |
2010 |
13.171 |
4.104 |
208 |
4.312 |
16.387 |
1.871 |
18.258 |
|
|
|
|
|
|
|
|
|
|
|
|
|
|
|
|
| |
2011 |
17.275 |
3.091 |
185 |
3.276 |
19.478 |
2.056 |
21.534 |
|
|
|
|
|
|
|
|
|
|
|
|
|
|
|
|
| |
2012 |
20.366 |
3.019 |
338 |
3.357 |
22.497 |
2.394 |
24.891 |
|
|
|
|
|
|
|
|
|
|
|
|
|
|
|
|
| |
2013 |
23.385 |
2.234 |
514 |
2.748 |
24.731 |
2.908 |
27.639 |
|
|
|
|
|
|
|
|
|
|
|
|
|
|
|
|
| |
2014 |
25.619 |
3.102 |
326 |
3.428 |
27.833 |
3.234 |
31.067 |
|
|
|
|
|
|
|
|
|
|
|
|
|
|
|
|
| |
2015 |
28.721 |
2.702 |
526 |
3.228 |
30.535 |
3.760 |
34.295 |
|
|
|
|
|
|
|
|
|
|
|
|
|
|
|
|
| |
2016 |
31.423 |
1.729 |
579 |
2.308 |
32.264 |
4.339 |
36.603 |
|
|
|
|
|
|
|
|
|
|
|
|
|
|
|
|
| |
2017 |
33.152 |
1.929 |
655 |
2.584 |
34.193 |
4.994 |
39.187 |
|
|
|
|
|
|
|
|
|
|
|
|
|
|
|
|
| |
2018 |
35.081 |
2.196 |
554 |
2.750 |
36.389 |
5.548 |
41.937 |
|
|
|
|
|
|
|
|
|
|
|
|
|
|
|
|
| |
2019 |
37.277 |
3.410 |
773 |
4.183 |
39.799 |
6.321 |
46.120 |
|
|
|
|
|
|
|
|
|
|
|
|
|
|
|
|
| |
2020 |
40.687 |
|
|
|
|
|
|
|
|
|
|
|
|
|
|
|
|
|
|
|
|
|
|
| |
Totaal |
|
39.799 |
6.321 |
46.120 |
|
|
|
|
|
|
|
|
|
|
|
|
|
|
|
|
|
|
|
| |
|
|
|
|
|
|
|
|
|
|
|
|
|
|
|
|
|
|
|
|
|
|
|
|
|
|
|
|
|
|
|
|
|
|
|
|
|
|
|
|
|
|
|
|
|
|
|
|
|