| |
1. Azië |
|
|
|
|
|
|
|
|
|
|
|
|
|
|
|
|
| |
|
|
|
|
|
|
|
|
|
|
|
|
|
|
|
|
|
|
|
|
|
|
|
|
| |
|
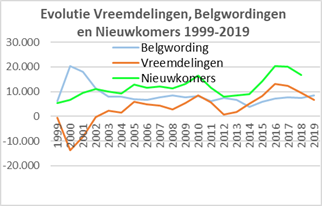
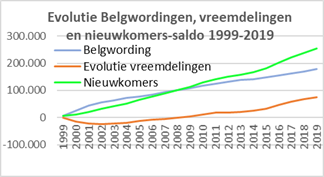
Evolutie
per jaar |
Cumul |
|
Evolutie vreemdelingen 1999-2009: |
3.915 |
|
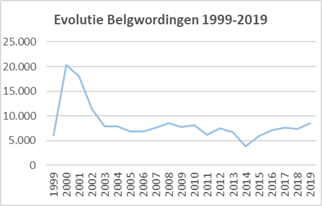
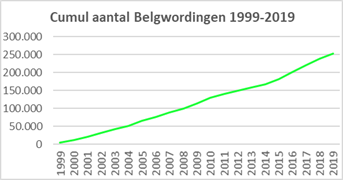
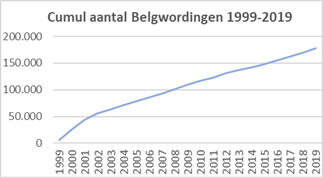
Belgwordingen 1999-2019: |
109.286 |
|
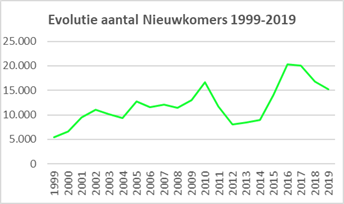
Nieuwkomers 1999-2019: |
113.201 |
|
| |
Jaar op |
Vreem- |
Evol. |
Belg- |
Nieuw- |
Evol. |
Belg- |
Nieuw- |
|
Evolutie vreemdelingen 2010-2019: |
71.404 |
|
Belgwordingen 1999-2019: |
68.953 |
|
Nieuwkomers 2010-2019: |
140.357 |
|
| |
01/01 |
delin- |
vreem- |
wor- |
komers- |
vreem- |
wor- |
komers- |
|
Evolutie vreemdelingen 1999-2019: |
75.319 |
|
Belgwordingen 1999-2019: |
178.239 |
|
Nieuwkomers 1999-2019: |
253.558 |
|
| |
|
gen |
deling |
dingen |
saldo |
deling |
dingen |
saldo |
|
|
|
|
|
|
|
|
|
|
|
|
|
|
|
|
| |
1999 |
101.848 |
-625 |
6.076 |
5.451 |
-625 |
6.076 |
5.451 |
|
|
|
|
|
|
|
|
|
|
|
|
|
|
|
|
| |
2000 |
101.223 |
-13.736 |
20.384 |
6.648 |
-14.361 |
26.460 |
12.099 |
|
|
|
|
|
|
|
|
|
|
|
|
|
|
|
|
| |
2001 |
87.487 |
-8.414 |
17.957 |
9.543 |
-22.775 |
44.417 |
21.642 |
|
|
|
|
|
|
|
|
|
|
|
|
|
|
|
|
| |
2002 |
79.073 |
-229 |
11.334 |
11.105 |
-23.004 |
55.751 |
32.747 |
|
|
|
|
|
|
|
|
|
|
|
|
|
|
|
|
| |
2003 |
78.844 |
2.200 |
7.938 |
10.138 |
-20.804 |
63.689 |
42.885 |
|
|
|
|
|
|
|
|
|
|
|
|
|
|
|
|
| |
2004 |
81.044 |
1.434 |
7.942 |
9.376 |
-19.370 |
71.631 |
52.261 |
|
|
|
|
|
|
|
|
|
|
|
|
|
|
|
|
| |
2005 |
82.478 |
5.878 |
6.911 |
12.789 |
-13.492 |
78.542 |
65.050 |
|
|
|
|
|
|
|
|
|
|
|
|
|
|
|
|
| |
2006 |
88.356 |
4.812 |
6.796 |
11.608 |
-8.680 |
85.338 |
76.658 |
|
|
|
|
|
|
|
|
|
|
|
|
|
|
|
|
| |
2007 |
93.168 |
4.410 |
7.666 |
12.076 |
-4.270 |
93.004 |
88.734 |
|
|
|
|
|
|
|
|
|
|
|
|
|
|
|
|
| |
2008 |
97.578 |
2.884 |
8.535 |
11.419 |
-1.386 |
101.539 |
100.153 |
|
|
|
|
|
|
|
|
|
|
|
|
|
|
|
|
| |
2009 |
100.462 |
5.301 |
7.747 |
13.048 |
3.915 |
109.286 |
113.201 |
|
|
|
|
|
|
|
|
|
|
|
|
|
|
|
|
| |
2010 |
105.763 |
8.484 |
8.126 |
16.610 |
12.399 |
117.412 |
129.811 |
|
|
|
|
|
|
|
|
|
|
|
|
|
|
|
|
| |
2011 |
114.247 |
5.561 |
6.141 |
11.702 |
17.960 |
123.553 |
141.513 |
|
|
|
|
|
|
|
|
|
|
|
|
|
|
|
|
| |
2012 |
119.808 |
627 |
7.460 |
8.087 |
18.587 |
131.013 |
149.600 |
|
|
|
|
|
|
|
|
|
|
|
|
|
|
|
|
| |
2013 |
120.435 |
1.701 |
6.734 |
8.435 |
20.288 |
137.747 |
158.035 |
|
|
|
|
|
|
|
|
|
|
|
|
|
|
|
|
| |
2014 |
122.136 |
5.189 |
3.807 |
8.996 |
25.477 |
141.554 |
167.031 |
|
|
|
|
|
|
|
|
|
|
|
|
|
|
|
|
| |
2015 |
127.325 |
8.102 |
5.997 |
14.099 |
33.579 |
147.551 |
181.130 |
|
|
|
|
|
|
|
|
|
|
|
|
|
|
|
|
| |
2016 |
135.427 |
13.239 |
7.093 |
20.332 |
46.818 |
154.644 |
201.462 |
|
|
|
|
|
|
|
|
|
|
|
|
|
|
|
|
| |
2017 |
148.666 |
12.393 |
7.640 |
20.033 |
59.211 |
162.284 |
221.495 |
|
|
|
|
|
|
|
|
|
|
|
|
|
|
|
|
| |
2018 |
161.059 |
9.461 |
7.366 |
16.827 |
68.672 |
169.650 |
238.322 |
|
|
|
|
|
|
|
|
|
|
|
|
|
|
|
|
| |
2019 |
170.520 |
6.647 |
8.589 |
15.236 |
75.319 |
178.239 |
253.558 |
|
|
|
|
|
|
|
|
|
|
|
|
|
|
|
|
| |
2020 |
177.167 |
|
|
|
|
|
|
|
|
|
|
|
|
|
|
|
|
|
|
|
|
|
|
| |
Totaal |
|
75.319 |
178.239 |
253.558 |
|
|
|
|
|
|
|
|
|
|
|
|
|
|
|
|
|
|
|
| |
|
|
|
|
|
|
|
|
|
|
|
|
|
|
|
|
|
|
|
|
|
|
|
|
|
|
|
|
|
|
|
|
|
|
|
|
|
|
|
|
|
|
|
|
|
|
|
|
|