| |
3. Amerika |
|
|
|
|
|
|
|
|
|
|
|
|
|
|
|
|
| |
|
|
|
|
|
|
|
|
|
|
|
|
|
|
|
|
|
|
|
|
|
|
|
|
| |
|
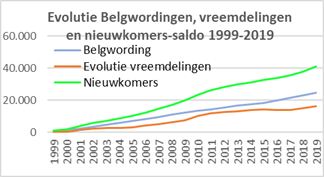
Evolutie
per jaar |
Cumul |
|
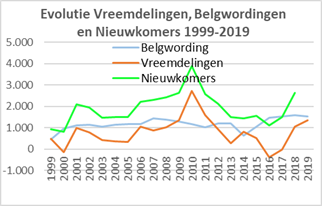
Evolutie vreemdelingen 1999-2009: |
7.495 |
|
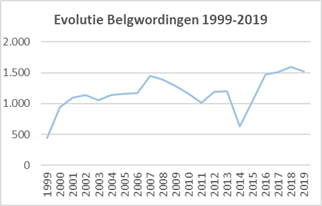
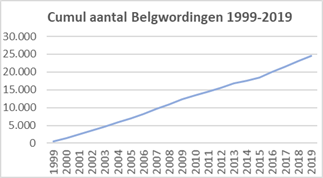
Belgwordingen 1999-2019: |
12.273 |
|
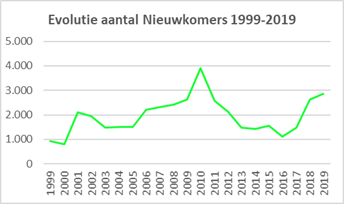
Nieuwkomers 1999-2019: |
19.768 |
|
| |
Jaar op |
Vreem- |
Evol. |
Belg- |
Nieuw- |
Evol. |
Belg- |
Nieuw- |
|
Evolutie vreemdelingen 2010-2019: |
8.827 |
|
Belgwordingen 1999-2019: |
12.340 |
|
Nieuwkomers 2010-2019: |
21.167 |
|
| |
01/01 |
delin- |
vreem- |
wor- |
komers- |
vreem- |
wor- |
komers- |
|
Evolutie vreemdelingen 1999-2019: |
16.322 |
|
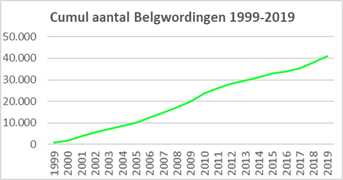
Belgwordingen 1999-2019: |
24.613 |
|
Nieuwkomers 1999-2019: |
40.935 |
|
| |
|
gen |
deling |
dingen |
saldo |
deling |
dingen |
saldo |
|
|
|
|
|
|
|
|
|
|
|
|
|
|
|
|
| |
1999 |
22.685 |
476 |
444 |
920 |
476 |
444 |
920 |
|
|
|
|
|
|
|
|
|
|
|
|
|
|
|
|
| |
2000 |
23.161 |
-150 |
946 |
796 |
326 |
1.390 |
1.716 |
|
|
|
|
|
|
|
|
|
|
|
|
|
|
|
|
| |
2001 |
23.011 |
999 |
1.100 |
2.099 |
1.325 |
2.490 |
3.815 |
|
|
|
|
|
|
|
|
|
|
|
|
|
|
|
|
| |
2002 |
24.010 |
794 |
1.143 |
1.937 |
2.119 |
3.633 |
5.752 |
|
|
|
|
|
|
|
|
|
|
|
|
|
|
|
|
| |
2003 |
24.804 |
421 |
1.056 |
1.477 |
2.540 |
4.689 |
7.229 |
|
|
|
|
|
|
|
|
|
|
|
|
|
|
|
|
| |
2004 |
25.225 |
360 |
1.138 |
1.498 |
2.900 |
5.827 |
8.727 |
|
|
|
|
|
|
|
|
|
|
|
|
|
|
|
|
| |
2005 |
25.585 |
334 |
1.159 |
1.493 |
3.234 |
6.986 |
10.220 |
|
|
|
|
|
|
|
|
|
|
|
|
|
|
|
|
| |
2006 |
25.919 |
1.041 |
1.167 |
2.208 |
4.275 |
8.153 |
12.428 |
|
|
|
|
|
|
|
|
|
|
|
|
|
|
|
|
| |
2007 |
26.960 |
859 |
1.450 |
2.309 |
5.134 |
9.603 |
14.737 |
|
|
|
|
|
|
|
|
|
|
|
|
|
|
|
|
| |
2008 |
27.819 |
1.028 |
1.387 |
2.415 |
6.162 |
10.990 |
17.152 |
|
|
|
|
|
|
|
|
|
|
|
|
|
|
|
|
| |
2009 |
28.847 |
1.333 |
1.283 |
2.616 |
7.495 |
12.273 |
19.768 |
|
|
|
|
|
|
|
|
|
|
|
|
|
|
|
|
| |
2010 |
30.180 |
2.732 |
1.163 |
3.895 |
10.227 |
13.436 |
23.663 |
|
|
|
|
|
|
|
|
|
|
|
|
|
|
|
|
| |
2011 |
32.912 |
1.573 |
1.011 |
2.584 |
11.800 |
14.447 |
26.247 |
|
|
|
|
|
|
|
|
|
|
|
|
|
|
|
|
| |
2012 |
34.485 |
938 |
1.186 |
2.124 |
12.738 |
15.633 |
28.371 |
|
|
|
|
|
|
|
|
|
|
|
|
|
|
|
|
| |
2013 |
35.423 |
280 |
1.203 |
1.483 |
13.018 |
16.836 |
29.854 |
|
|
|
|
|
|
|
|
|
|
|
|
|
|
|
|
| |
2014 |
35.703 |
796 |
632 |
1.428 |
13.814 |
17.468 |
31.282 |
|
|
|
|
|
|
|
|
|
|
|
|
|
|
|
|
| |
2015 |
36.499 |
512 |
1.044 |
1.556 |
14.326 |
18.512 |
32.838 |
|
|
|
|
|
|
|
|
|
|
|
|
|
|
|
|
| |
2016 |
37.011 |
-370 |
1.475 |
1.105 |
13.956 |
19.987 |
33.943 |
|
|
|
|
|
|
|
|
|
|
|
|
|
|
|
|
| |
2017 |
36.641 |
-22 |
1.512 |
1.490 |
13.934 |
21.499 |
35.433 |
|
|
|
|
|
|
|
|
|
|
|
|
|
|
|
|
| |
2018 |
36.619 |
1.039 |
1.590 |
2.629 |
14.973 |
23.089 |
38.062 |
|
|
|
|
|
|
|
|
|
|
|
|
|
|
|
|
| |
2019 |
37.658 |
1.349 |
1.524 |
2.873 |
16.322 |
24.613 |
40.935 |
|
|
|
|
|
|
|
|
|
|
|
|
|
|
|
|
| |
2020 |
39.007 |
|
|
|
|
|
|
|
|
|
|
|
|
|
|
|
|
|
|
|
|
|
|
| |
Totaal |
|
16.322 |
24.613 |
40.935 |
|
|
|
|
|
|
|
|
|
|
|
|
|
|
|
|
|
|
|
| |
|
|
|
|
|
|
|
|
|
|
|
|
|
|
|
|
|
|
|
|
|
|
|
|
|
|
|
|
|
|
|
|
|
|
|
|
|
|
|
|
|
|
|
|
|
|
|
|
|