| Uitslagen politieke partijen 2010-2024 | in | Puurs-Sint-A | Uitslagen CD&V | Uitslagen Groen | Uitslagen Vooruit | |||||||||||||||||||||||||||||||||||||||||||||||||||||||||||||||||||||||||||||||||
|
||||||||||||||||||||||||||||||||||||||||||||||||||||||||||||||||||||||||||||||||||||||
| Puurs-Sint-Amands | Uitslagen partijen 2010-2024 | |||||||||||||||||||||||||||||||||||||||||||||||||||||||||||||||||||||||||||||||||||||
| 2010 | 2012 | 2014 | 2018 | 2019 | 2024 | |||||||||||||||||||||||||||||||||||||||||||||||||||||||||||||||||||||||||||||||||
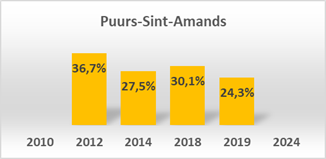
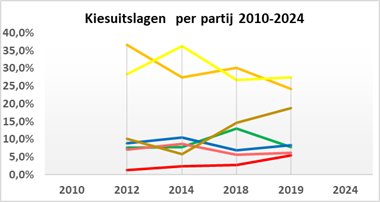
| CD&V | 36,7% | 27,5% | 30,1% | 24,3% | ||||||||||||||||||||||||||||||||||||||||||||||||||||||||||||||||||||||||||||||||||
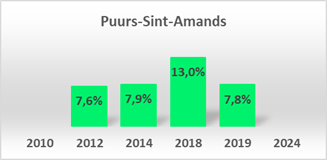
| Groen | 7,6% | 7,9% | 13,0% | 7,8% | ||||||||||||||||||||||||||||||||||||||||||||||||||||||||||||||||||||||||||||||||||
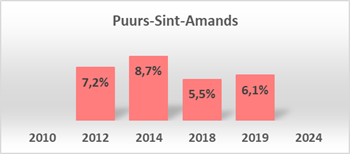
| Vooruit | 7,2% | 8,7% | 5,5% | 6,1% | ||||||||||||||||||||||||||||||||||||||||||||||||||||||||||||||||||||||||||||||||||
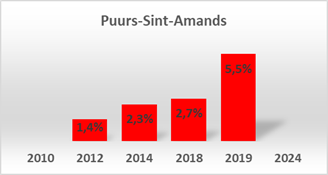
| PVDA | 1,4% | 2,3% | 2,7% | 5,5% | ||||||||||||||||||||||||||||||||||||||||||||||||||||||||||||||||||||||||||||||||||
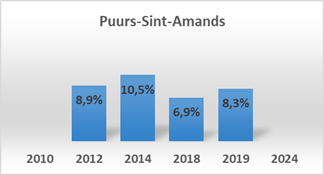
| Open VLD | 8,9% | 10,5% | 6,9% | 8,3% | ||||||||||||||||||||||||||||||||||||||||||||||||||||||||||||||||||||||||||||||||||
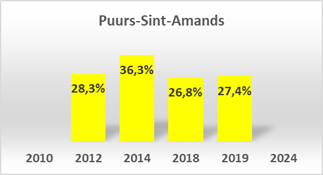
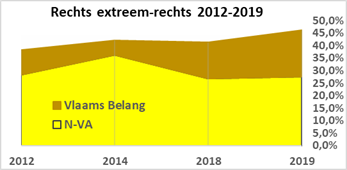
| N-VA | 28,3% | 36,3% | 26,8% | 27,4% | ||||||||||||||||||||||||||||||||||||||||||||||||||||||||||||||||||||||||||||||||||
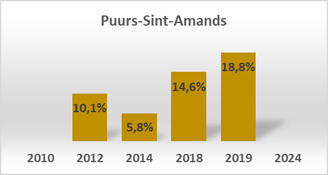
| Vlaams Belang | 10,1% | 5,8% | 14,6% | 18,8% | ||||||||||||||||||||||||||||||||||||||||||||||||||||||||||||||||||||||||||||||||||
| LDD | 0,0% | 0,0% | 0,0% | 0,0% | ||||||||||||||||||||||||||||||||||||||||||||||||||||||||||||||||||||||||||||||||||
| ROSSEM | 0,0% | 0,2% | 0,0% | 0,0% | Uitslagen Open VLD | Uitslagen PVDA | Puurs-Sint-Amands | |||||||||||||||||||||||||||||||||||||||||||||||||||||||||||||||||||||||||||||||
|
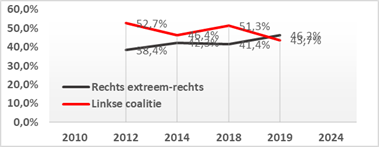
Rechts Extr.-Rechts | 38,4% | 42,3% | 41,4% | 46,2% | |||||||||||||||||||||||||||||||||||||||||||||||||||||||||||||||||||||||||||||||||
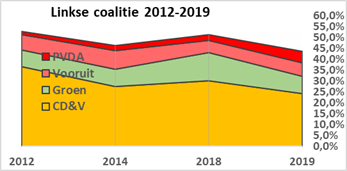
| Linkse coalitie | 52,7% | 46,4% | 51,3% | 43,7% | ||||||||||||||||||||||||||||||||||||||||||||||||||||||||||||||||||||||||||||||||||
| Uitslagen N-VA | Uitslagen Vlaams Belang | Puurs | ||||||||||||||||||||||||||||||||||||||||||||||||||||||||||||||||||||||||||||||||||||